UBS 1Q24 net profit of USD 1.8bn and underlying PBT of USD 2.6bn; integration priorities on track (Ad hoc announcement pursuant to Article 53 of the SIX Exchange Regulation Listing Rules)
This press release features multimedia. View the full release here: https://www.businesswire.com/news/home/20240506952345/en/
Key highlights (Graphic:
Key highlights
-
1Q24 PBT of
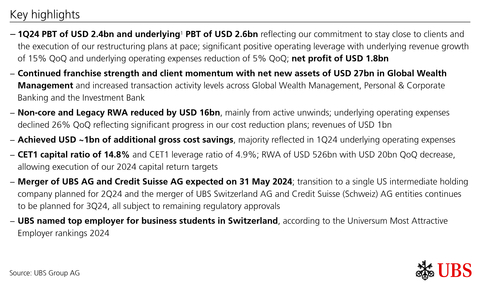
USD 2.4bn and underlying 1 PBT ofUSD 2.6bn reflecting our commitment to stay close to clients and the execution of our restructuring plans at pace; significant positive operating leverage with underlying revenue growth of 15% QoQ and underlying operating expenses reduction of 5% QoQ; net profit ofUSD 1.8bn -
Continued franchise strength and client momentum with net new assets of
USD 27bn in Global Wealth Management and increased transaction activity levels across Global Wealth Management, Personal & Corporate Banking and theInvestment Bank -
Non-core and Legacy RWA
reduced by
USD 16bn , mainly from active unwinds; underlying operating expenses declined 26% QoQ reflecting significant progress in our cost reduction plans; revenues ofUSD 1bn - Achieved USD ~1bn of additional gross cost savings, majority reflected in 1Q24 underlying operating expenses
-
CET1 capital ratio of 14.8% and CET1 leverage ratio of 4.9%; RWA of
USD 526bn withUSD 20bn QoQ decrease, allowing execution of our 2024 capital return targets -
Merger of
UBS AG and Credit Suisse AG expected on 31May 2024 ; transition to a single US intermediate holding company planned for 2Q24 and the merger ofUBS Switzerland AG andCredit Suisse (Schweiz) AG entities continues to be planned for 3Q24, all subject to remaining regulatory approvals -
UBS named top employer for business students inSwitzerland , according to the Universum Most Attractive Employer rankings 2024
“A little over a year ago, we were asked to play a critical role in stabilizing the Swiss and global financial systems through the acquisition of Credit Suisse and we are delivering on our commitments. This quarter marks the return to reported net profits and further capital accretion – a testament to the strength of our business and client franchises and our ability to deliver significant progress on our integration plans while actively optimizing our financial resources.”
Selected financials for 1Q24
|
Profit before tax 2.4 USD bn |
Cost/income ratio 80.5 % |
RoCET1 capital 9.0 % |
Net profit 1.8 USD bn |
CET1 capital ratio 14.8 % |
|
Underlying1
2.6 USD bn |
Underlying1
77.2 % |
Underlying1
9.6 % |
Diluted
0.52 USD |
CET1
4.9 % |
|
Information in this news release is presented for |
|
1 Underlying results exclude items of profit or loss that management believes are not representative of the underlying performance. Underlying results are a non-GAAP financial measure and alternative performance measure (APM). Refer to “Group Performance” and “Appendix-Alternative Performance Measures” in the financial report for the first quarter of 2024 for a reconciliation of underlying to reported results and definitions of the APMs. |
Group summary
Return to reported pre- and post-tax profitability
In 1Q24, we reported PBT of
Total reported revenues reached
Continued franchise strength and client momentum
We remain focused on serving our clients. This was evidenced by
We also saw client demand in AM, with
In the IB, we carried positive momentum in Global Banking with underlying revenues up by 52% YoY to
On track with cost and balance sheet reduction plans, supporting delivery of integration priorities
We continue to execute our integration plans at pace. In 1Q24, we realized an additional USD ~1bn in gross cost savings, for a total of USD ~5bn in annualized exit rate gross cost savings vs. FY22 combined, nearly 40% of our 2026 exit-rate ambition of USD ~13bn. We aim to achieve another USD ~1.5bn in gross cost savings by the end of 2024.
We made substantial progress in reducing the
We expect to complete the merger of
Significant progress on financial resources optimization for sustainably higher returns
We made significant progress in reducing financial resource consumption across the bank, with
On
Maintained a balance sheet for all seasons
The CET1 capital ratio was 14.8% and the CET1 leverage ratio was 4.9%, allowing execution of our 2024 capital return targets. At the end of the quarter, LCR stood at 220% and NSFR at 126%.
Outlook
Although monetary easing is expected in the
In the second quarter of 2024, we expect a low-to-mid single-digit decline in net interest income in Global Wealth Management, due to moderately lower lending and deposit volumes and lower interest rates in
In addition to executing on our integration plans, we will remain focused on serving our clients, following through on our strategy, investing in our people and remaining a pillar of economic support in the communities where we live and work.
First quarter 2024 performance overview – Group
Group PBT
PBT of
Global Wealth Management (GWM) PBT
Total revenues increased 28% to
Personal & Corporate Banking (P&C) PBT
Total revenues increased 81% to
Asset Management (AM) PBT
Total revenues increased 54% to
Total revenues increased 16% to
Non-core and Legacy (NCL) PBT
Total revenues were
Group Items PBT
UBS’s sustainability approach through the integration
In
Integrated policy frameworks and processes
Following the acquisition of Credit Suisse, we have implemented a revised Sustainability & Climate Risk framework and associated processes to reflect the full suite of activities of the combined business and ensure a consistent approach. We have also moved swiftly to transition portfolios in carbon-intensive sectors that do not align with our approach and risk appetite into Non-Core and Legacy to be managed off our balance sheet over time.
New baselines and financing targets
We have established new baselines and updated UBS’s 2030 emissions targets for fossil fuels, power generation, cement and real estate mortgage lending. In addition, we added a target for iron and steel and continue disclosing in-scope ship finance portfolios according to the Poseidon Principles decarbonization trajectories with the aim of aligning.
We remain committed to our ambition to achieve net-zero greenhouse gas emissions across our scope 1 and 2, and specified scope 3 activities by 2050, with decarbonization targets for 2025, 2030 and 2035. At the same time, we recognize there is more to do and aim to phase in additional scope 3 activities over time.
Business students across
|
Selected financial information of our business divisions and Group Items |
|||||||
|
|
For the quarter ended |
||||||
|
USD m |
Global Wealth Management |
Personal & Corporate Banking |
Asset Management |
Investment Bank |
Non-core and Legacy |
Group Items |
Total |
|
Total revenues as reported |
6,143 |
2,423 |
776 |
2,751 |
1,001 |
(355) |
12,739 |
|
of which: PPA effects and other integration items1 |
234 |
256 |
|
293 |
|
(4) |
779 |
|
Total revenues (underlying) |
5,909 |
2,166 |
776 |
2,458 |
1,001 |
(351) |
11,960 |
|
Credit loss expense / (release) |
(3) |
44 |
0 |
32 |
36 |
(2) |
106 |
|
Operating expenses as reported |
5,044 |
1,404 |
665 |
2,164 |
1,011 |
(33) |
10,257 |
|
of which: integration-related expenses and PPA effects2 |
404 |
160 |
71 |
143 |
242 |
1 |
1,021 |
|
Operating expenses (underlying) |
4,640 |
1,245 |
594 |
2,022 |
769 |
(34) |
9,236 |
|
Operating profit / (loss) before tax as reported |
1,102 |
975 |
111 |
555 |
(46) |
(320) |
2,376 |
|
Operating profit / (loss) before tax (underlying) |
1,272 |
878 |
182 |
404 |
197 |
(315) |
2,617 |
|
|
|||||||
|
|
For the quarter ended |
||||||
|
USD m |
Global Wealth Management |
Personal & Corporate Banking |
Asset Management |
Investment Bank |
Non-core and Legacy |
Group Items |
Total |
|
Total revenues as reported |
5,554 |
2,083 |
825 |
2,141 |
145 |
107 |
10,855 |
|
of which: PPA effects and other integration items1 |
349 |
306 |
|
277 |
|
12 |
944 |
|
of which: losses related to investment in |
(190) |
(317) |
|
|
|
|
(508) |
|
Total revenues (underlying) |
5,395 |
2,094 |
825 |
1,864 |
145 |
95 |
10,419 |
|
Credit loss expense / (release) |
(8) |
85 |
(1) |
48 |
15 |
(2) |
136 |
|
Operating expenses as reported |
5,282 |
1,398 |
704 |
2,283 |
1,787 |
16 |
11,470 |
|
of which: integration-related expenses and PPA effects2 |
502 |
187 |
64 |
167 |
750 |
109 |
1,780 |
|
of which: acquisition-related costs |
|
|
|
|
|
(1) |
(1) |
|
Operating expenses (underlying) |
4,780 |
1,210 |
639 |
2,116 |
1,037 |
(92) |
9,690 |
|
Operating profit / (loss) before tax as reported |
280 |
601 |
122 |
(190) |
(1,657) |
93 |
(751) |
|
Operating profit / (loss) before tax (underlying) |
624 |
800 |
186 |
(300) |
(907) |
189 |
592 |
|
|
|||||||
|
|
For the quarter ended |
||||||
|
USD m |
Global Wealth Management |
Personal & Corporate Banking |
Asset Management |
Investment Bank |
Non-core and Legacy |
Group Items |
Total |
|
Total revenues as reported |
4,788 |
1,277 |
503 |
2,365 |
23 |
(211) |
8,744 |
|
Total revenues (underlying) |
4,788 |
1,277 |
503 |
2,365 |
23 |
(211) |
8,744 |
|
Credit loss expense / (release) |
15 |
16 |
0 |
7 |
0 |
0 |
38 |
|
Operating expenses as reported |
3,561 |
663 |
408 |
1,866 |
699 |
14 |
7,210 |
|
of which: acquisition-related costs |
|
|
|
|
|
70 |
70 |
|
Operating expenses (underlying) |
3,561 |
663 |
408 |
1,866 |
699 |
(57) |
7,140 |
|
Operating profit / (loss) before tax as reported |
1,212 |
598 |
95 |
492 |
(676) |
(225) |
1,495 |
|
Operating profit / (loss) before tax (underlying) |
1,212 |
598 |
95 |
492 |
(676) |
(155) |
1,566 |
|
1 Includes accretion of PPA adjustments on financial instruments and other PPA effects, as well as temporary and incremental items directly related to the integration. 2 Includes temporary, incremental operating expenses directly related to the integration, as well as amortization of newly recognized intangibles resulting from the acquisition of the Credit Suisse Group. 3 Comparative-period information has been restated for changes in business division perimeters, Group Treasury allocations and Non-core and Legacy cost allocations. Refer to “Changes to segment reporting in 2024” in the “UBS business divisions and Group Items” section below and “Note 3 Segment reporting” in the “Consolidated financial statements” section of the
|
|||||||
|
Our key figures |
|
|
|
|
|
|
|
As of or for the quarter ended |
||
|
USD m, except where indicated |
|
|
|
|
|
Group results |
|
|
|
|
|
Total revenues |
|
12,739 |
10,855 |
8,744 |
|
Credit loss expense / (release) |
|
106 |
136 |
38 |
|
Operating expenses |
|
10,257 |
11,470 |
7,210 |
|
Operating profit / (loss) before tax |
|
2,376 |
(751) |
1,495 |
|
Net profit / (loss) attributable to shareholders |
|
1,755 |
(279) |
1,029 |
|
Diluted earnings per share (USD)2 |
|
0.52 |
(0.09) |
0.32 |
|
Profitability and growth3,4,5 |
|
|
|
|
|
Return on equity (%) |
|
8.2 |
(1.3) |
7.2 |
|
Return on tangible equity (%) |
|
9.0 |
(1.4) |
8.1 |
|
Underlying return on tangible equity (%)6 |
|
9.6 |
4.8 |
8.7 |
|
Return on common equity tier 1 capital (%) |
|
9.0 |
(1.4) |
9.1 |
|
Underlying return on common equity tier 1 capital (%)6 |
|
9.6 |
4.7 |
9.8 |
|
Return on leverage ratio denominator, gross (%) |
|
3.1 |
2.6 |
3.4 |
|
Cost / income ratio (%) |
|
80.5 |
105.7 |
82.5 |
|
Underlying cost / income ratio (%)6 |
|
77.2 |
93.0 |
81.7 |
|
Effective tax rate (%) |
|
25.8 |
n.m.7 |
30.7 |
|
Net profit growth (%) |
|
70.6 |
n.m. |
(51.8) |
|
Resources3 |
|
|
|
|
|
Total assets |
|
1,607,120 |
1,717,246 |
1,053,134 |
|
Equity attributable to shareholders |
|
85,260 |
86,108 |
56,754 |
|
Common equity tier 1 capital8 |
|
78,147 |
78,485 |
44,590 |
|
Risk-weighted assets8 |
|
526,437 |
546,505 |
321,660 |
|
Common equity tier 1 capital ratio (%)8 |
|
14.8 |
14.4 |
13.9 |
|
Going concern capital ratio (%)8 |
|
17.8 |
16.9 |
17.9 |
|
Total loss-absorbing capacity ratio (%)8 |
|
37.5 |
36.5 |
34.3 |
|
Leverage ratio denominator8 |
|
1,599,646 |
1,695,403 |
1,014,446 |
|
Common equity tier 1 leverage ratio (%)8 |
|
4.9 |
4.6 |
4.4 |
|
Liquidity coverage ratio (%)9 |
|
220.2 |
215.7 |
161.9 |
|
Net stable funding ratio (%) |
|
126.4 |
124.7 |
117.7 |
|
Other |
|
|
|
|
|
Invested assets (USD bn)4,10,11 |
|
5,848 |
5,714 |
4,184 |
|
Personnel (full-time equivalents) |
|
111,549 |
112,842 |
73,814 |
|
Market capitalization2,12 |
|
106,440 |
107,355 |
74,276 |
|
Total book value per share (USD)2 |
|
26.59 |
26.83 |
18.59 |
|
Tangible book value per share (USD)2 |
|
24.29 |
24.49 |
16.54 |
|
1 Comparative-period information has been revised. Refer to “Note 2 Accounting for the acquisition of the Credit Suisse Group” in the “Consolidated financial statements” section of the UBS Group Annual Report 2023, available under “Annual reporting” at ubs.com/investors, for more information. 2 Refer to the “Share information and earnings per share” section of the
|
||||
|
Income statement |
|
|
|
|
|
|
|
|
|
|
For the quarter ended |
|
% change from |
|||
|
USD m |
|
|
|
|
|
4Q23 |
1Q23 |
|
Net interest income |
|
1,940 |
2,095 |
1,388 |
|
(7) |
40 |
|
Other net income from financial instruments measured at fair value through profit or loss |
|
4,182 |
3,158 |
2,681 |
|
32 |
56 |
|
Net fee and commission income |
|
6,492 |
5,780 |
4,606 |
|
12 |
41 |
|
Other income |
|
124 |
(179) |
69 |
|
|
79 |
|
Total revenues |
|
12,739 |
10,855 |
8,744 |
|
17 |
46 |
|
Credit loss expense / (release) |
|
106 |
136 |
38 |
|
(22) |
177 |
|
|
|
|
|
|
|
|
|
|
Personnel expenses |
|
6,949 |
7,061 |
4,620 |
|
(2) |
50 |
|
General and administrative expenses |
|
2,413 |
2,999 |
2,065 |
|
(20) |
17 |
|
Depreciation, amortization and impairment of non-financial assets |
|
895 |
1,409 |
525 |
|
(37) |
70 |
|
Operating expenses |
|
10,257 |
11,470 |
7,210 |
|
(11) |
42 |
|
Operating profit / (loss) before tax |
|
2,376 |
(751) |
1,495 |
|
|
59 |
|
Tax expense / (benefit) |
|
612 |
(473) |
459 |
|
|
33 |
|
Net profit / (loss) |
|
1,764 |
(278) |
1,037 |
|
|
70 |
|
Net profit / (loss) attributable to non-controlling interests |
|
9 |
1 |
8 |
|
|
7 |
|
Net profit / (loss) attributable to shareholders |
|
1,755 |
(279) |
1,029 |
|
|
71 |
|
|
|
|
|
|
|
|
|
|
Comprehensive income |
|
|
|
|
|
|
|
|
Total comprehensive income |
|
(245) |
2,695 |
1,833 |
|
|
|
|
Total comprehensive income attributable to non-controlling interests |
|
(5) |
18 |
13 |
|
|
|
|
Total comprehensive income attributable to shareholders |
(240) |
2,677 |
1,820 |
|
|
||
|
Financial and regulatory key figures for our significant regulated subsidiaries and sub-groups |
|||||||||
|
|
|
(consolidated) |
|
(standalone) |
|
Credit Suisse AG (consolidated) |
|||
|
All values in million, except where indicated |
|
USD |
|
USD |
|
CHF |
|||
|
Financial and regulatory requirements |
|
IFRS Accounting Standards Swiss SRB rules |
|
IFRS Accounting Standards Swiss SRB rules |
|
US GAAP Swiss SRB rules |
|||
|
As of or for the quarter ended |
|
|
|
|
|
|
|
|
|
|
|
|
|
|
|
|
|
|
|
|
|
Financial information1 |
|
|
|
|
|
|
|
|
|
|
Income statement |
|
|
|
|
|
|
|
|
|
|
Total operating income2 |
|
9,056 |
7,951 |
|
2,365 |
2,254 |
|
1,606 |
1,268 |
|
Total operating expenses |
|
7,677 |
7,618 |
|
2,203 |
2,205 |
|
3,011 |
4,005 |
|
Operating profit / (loss) before tax |
|
1,379 |
333 |
|
163 |
49 |
|
(1,405) |
(2,737) |
|
Net profit / (loss) |
|
1,014 |
242 |
|
216 |
(48) |
|
(1,501) |
(2,749) |
|
Balance sheet |
|
|
|
|
|
|
|
|
|
|
Total assets |
|
1,116,806 |
1,156,016 |
|
676,385 |
698,149 |
|
420,376 |
452,507 |
|
Total liabilities |
|
1,061,443 |
1,100,448 |
|
621,007 |
642,602 |
|
382,177 |
414,391 |
|
Total equity |
|
55,363 |
55,569 |
|
55,379 |
55,546 |
|
38,199 |
38,116 |
|
|
|
|
|
|
|
|
|
|
|
|
Capital3 |
|
|
|
|
|
|
|
|
|
|
Common equity tier 1 capital |
|
43,863 |
44,130 |
|
51,971 |
52,553 |
|
38,382 |
38,187 |
|
Additional tier 1 capital |
|
14,204 |
12,498 |
|
14,204 |
12,498 |
|
466 |
458 |
|
Total going concern capital / Tier 1 capital |
|
58,067 |
56,628 |
|
66,175 |
65,051 |
|
38,848 |
38,646 |
|
Tier 2 capital |
|
537 |
538 |
|
532 |
533 |
|
|
|
|
Total gone concern loss-absorbing capacity |
|
54,773 |
54,458 |
|
54,768 |
54,452 |
|
37,933 |
38,284 |
|
Total loss-absorbing capacity |
|
112,840 |
111,086 |
|
120,943 |
119,504 |
|
76,782 |
76,930 |
|
|
|
|
|
|
|
|
|
|
|
|
Risk-weighted assets and leverage ratio denominator3 |
|
|
|
|
|
|
|
|
|
|
Risk-weighted assets |
|
328,732 |
333,979 |
|
356,821 |
354,083 |
|
173,285 |
181,690 |
|
Leverage ratio denominator |
|
1,078,591 |
1,104,408 |
|
641,315 |
643,939 |
|
485,606 |
524,968 |
|
|
|
|
|
|
|
|
|
|
|
|
Capital and leverage ratios (%)3 |
|
|
|
|
|
|
|
|
|
|
Common equity tier 1 capital ratio |
|
13.3 |
13.2 |
|
14.6 |
14.8 |
|
22.1 |
21.0 |
|
Going concern capital ratio / Tier 1 capital ratio |
|
17.7 |
17.0 |
|
18.5 |
18.4 |
|
22.4 |
21.3 |
|
Total loss-absorbing capacity ratio |
|
34.3 |
33.3 |
|
|
|
|
44.3 |
42.3 |
|
Going concern leverage ratio |
|
5.4 |
5.1 |
|
10.3 |
10.1 |
|
8.0 |
7.4 |
|
Total loss-absorbing capacity leverage ratio |
|
10.5 |
10.1 |
|
|
|
|
15.8 |
14.7 |
|
Gone concern capital coverage ratio |
|
|
|
|
105.9 |
112.5 |
|
|
|
|
|
|
|
|
|
|
|
|
|
|
|
Liquidity coverage ratio3 |
|
|
|
|
|
|
|
|
|
|
High-quality liquid assets (bn) |
|
251.0 |
254.5 |
|
123.7 |
130.0 |
|
149.6 |
142.6 |
|
Net cash outflows (bn) |
|
131.3 |
134.3 |
|
46.1 |
50.4 |
|
56.8 |
53.8 |
|
Liquidity coverage ratio (%) |
|
191.4 |
189.7 |
|
268.74 |
260.2 |
|
263.35 |
265.1 |
|
|
|
|
|
|
|
|
|
|
|
|
Net stable funding ratio3 |
|
|
|
|
|
|
|
|
|
|
Total available stable funding (bn) |
|
589.3 |
602.6 |
|
274.6 |
279.8 |
|
272.9 |
287.1 |
|
Total required stable funding (bn) |
|
484.7 |
503.8 |
|
288.3 |
304.9 |
|
199.4 |
213.1 |
|
Net stable funding ratio (%) |
|
121.6 |
119.6 |
|
95.26 |
91.7 |
|
136.9 |
134.7 |
|
1 The financial information disclosed does not represent financial statements under the respective GAAP / IFRS Accounting Standards. 2 The total operating income includes credit loss expense or release. 3 Refer to the |
|||||||||
Information about results materials and the earnings call
UBS’s first quarter 2024 report, news release and slide presentation are available from
|
Time
03:00 US EDT |
|
Audio webcast The presentation for analysts can be followed live on ubs.com/quarterlyreporting with a simultaneous slide show. |
|
Webcast playback An audio playback of the results presentation will be made available at ubs.com/investors later in the day. |
Cautionary statement regarding forward-looking statements
This news release contains statements that constitute “forward-looking statements,” including but not limited to management’s outlook for UBS’s financial performance, statements relating to the anticipated effect of transactions and strategic initiatives on UBS’s business and future development and goals or intentions to achieve climate, sustainability and other social objectives. While these forward-looking statements represent UBS’s judgments, expectations and objectives concerning the matters described, a number of risks, uncertainties and other important factors could cause actual developments and results to differ materially from UBS’s expectations. In particular, terrorist activity and conflicts in the
Rounding
Numbers presented throughout this news release may not add up precisely to the totals provided in the tables and text. Percentages and percent changes disclosed in text and tables are calculated on the basis of unrounded figures. Absolute changes between reporting periods disclosed in the text, which can be derived from numbers presented in related tables, are calculated on a rounded basis.
Tables
Within tables, blank fields generally indicate non-applicability or that presentation of any content would not be meaningful, or that information is not available as of the relevant date or for the relevant period. Zero values generally indicate that the respective figure is zero on an actual or rounded basis. Values that are zero on a rounded basis can be either negative or positive on an actual basis.
Websites
In this news release, any website addresses are provided solely for information and are not intended to be active links.
View source version on businesswire.com: https://www.businesswire.com/news/home/20240506952345/en/
Investor contact
Media contact
APAC: +852-297-1 82 00
Source:
