AB InBev Reports Second Quarter 2024 Results
Consistent execution of our strategy delivered double-digit EBITDA growth with margin expansion of 236bps and a 25% increase in Underlying EPS
This press release features multimedia. View the full release here: https://www.businesswire.com/news/home/20240731260058/en/
AB InBev Strategic Priorities (Graphic: Business Wire)
Regulated information1
“Our global momentum continued this quarter. The strength of our diversified footprint and consumer demand for our megabrands delivered another quarter of broad-based top- and bottom-line growth
.
EBITDA grew by double-digits and the continued optimization of our business drove a 25% increase in Underlying EPS. We are encouraged with our performance in the first half of the year and remain focused on consistent execution of our strategy.”
–
|
Total Revenue + 2.7% Revenue increased by 2.7% in 2Q24 with revenue per hl growth of 3.6% and by 2.7% in HY24 with revenue per hl growth of 3.5%.
3.3%increase in combined revenues of our megabrands, led by Corona, which grew by 5.6% outside of its home market in 2Q24.
Approximately 70%of our revenue is through B2B digital platforms with the monthly active user base of BEES reaching 3.8 million users in 2Q24.
Approximately
Total Volume - 0.8% In 2Q24, total volumes declined by 0.8%, with own beer volumes down by 1.3% and non-beer volumes up by 3.4%. In HY24, total volumes declined by 0.7% with own beer volumes down by 1.3% and non-beer volumes up by 3.5%.
|
Normalized EBITDA + 10.2%
In 2Q24, normalized EBITDA increased by 10.2% to 5
In HY24, normalized EBITDA increased by 7.8% to 10
Underlying Profit
1
Underlying profit (profit attributable to equity holders of
Underlying EPS
Underlying EPS was
|
|
Net Debt to EBITDA 3.42x
Net debt to normalized EBITDA ratio was 3.42x at |
|
The 2024 Half Year Financial Report is available on our website at www.ab-inbev.com
|
1The enclosed information constitutes regulated information as defined in the Belgian Royal Decree of |
Management comments
Consistent execution of our strategy delivered double-digit EBITDA growth with margin expansion of 236bps and a 25% increase in Underlying EPS
Top-line increased by 2.7%, with revenue growth in approximately 65% of our markets, driven by a revenue per hl increase of 3.6% as a result of revenue management initiatives. Volume growth in our Middle Americas,
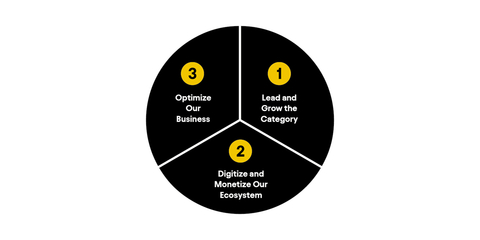
Progressing our strategic priorities
We continue to execute on and invest in three key strategic pillars to deliver consistent growth and long-term value creation.
(1) Lead and grow the category:
We delivered volume growth in 50% of our markets in 2Q24 and gained market share in the majority in HY24, according to our estimates.
(2) Digitize and monetize our ecosystem:
BEES captured
(3) Optimize our business:
We continue to make progress on deleveraging with net debt to EBITDA reaching 3.42x as of
(1) Lead and grow the category
We continued to invest in our megabrands, mega platforms and brand building capabilities this quarter. According to the Kantar BrandZ 2024 report, our portfolio now holds 8 of the top 10 most valuable beer brands in the world, with Corona and Budweiser #1 and #2 respectively. Our marketing effectiveness and creativity were recognized by again being named the most effective marketer in the world by both Effies and the
- Category Participation : Through our focus on brand, pack and liquid innovations, the percentage of consumers purchasing our portfolio of brands increased in approximately 40% of our markets in 2Q24, according to our estimates. Participation increases were led by improvements with all consumer groups in the US.
-
Core Superiority:
Our mainstream portfolio delivered a mid-single digit revenue increase in 2Q24, driven by double-digit growth in
Colombia ,South Korea and theDominican Republic . -
Occasions Development : Our global no-alcohol beer portfolio delivered high-teens revenue growth this quarter. Corona Cero, the official partner of theOlympic Games , is now available in approximately 40 markets and delivered triple-digit volume growth in 2Q24. The combination of our digital direct-to-consumer (DTC) products and our megabrands is developing new consumption occasions. For example, across markets inLatin America , Zé Delivery and TaDa Delivery significantly increased soccer game-time beer orders versus 2Q23 by engaging consumers withCopa America and other key event related activations. -
Premiumization:
In 2Q24, the Corona brand grew revenue by mid-single digits globally, outside of
Mexico . Our overall above core beer portfolio growth wasconstrained by a soft industry inChina . The combined revenue of our global brands declined by 1.7% outside of their home markets, while our overall above core beer portfolio delivered slight revenue growth, driven by Corona, our global brands inSouth Africa , and the double-digit growth of Modelo inMexico and Spaten inBrazil . -
Beyond Beer:
Our global Beyond Beer business contributed approximately
375 million USD of revenue in 2Q24, a low-single digit decrease versus 2Q23, as growth in key brands such as Brutal Fruit, Cutwater, Nutrl and Beats was primarily offset by a soft malt-based seltzer industry inNorth America .
(2) Digitize and monetize our ecosystem
-
Digitizing our relationships with more than 6 million customers globally:
As of
30 June 2024 , BEES is live in 27 markets with approximately 70% of our 2Q24 revenues captured through B2B digital platforms. In 2Q24,BEES had 3.8 million monthly active users and captured11.7 billion USD in gross merchandise value (GMV), growth of 18% and 20% versus 2Q23 respectively.BEES Marketplace generated 8.3 million orders and captured530 million USD in GMV from sales of third-party products in 2Q24, growth of 33% and 55% versus 2Q23 respectively.
-
Leading the way in DTC solutions:
Our omnichannel DTC ecosystem of digital and physical products generated revenue of approximately
400 million USD in 2Q24. Our DTC megabrands, Zé Delivery, TaDa Delivery and PerfectDraft, are available in 21 markets, generated 18.6 million ecommerce orders and delivered140 million USD in revenue, representing approximately 10% growth versus 2Q23.
(3) Optimize our business
-
Maximizing value creation:
Our Underlying EPS was
0.90 USD this quarter, a 25% increase versus 2Q23, driven primarily by nominal EBITDA growth. Our net debt to EBITDA ratio reached 3.42x versus 3.70x as of30 June 2023 , a slight increase versus 3.38x as of31 December 2023 due to the seasonality of our cash flow generation. The combination of EBITDA growth, our relentless focus on optimization of our net finance costs and net working capital, and improved capex efficiency delivered free cash flow of approximately0.9 billion USD in HY24, a1.4 billion USD improvement versus HY23. - Advancing our sustainability priorities: In Climate Action, our Scopes 1 and 2 emissions per hectoliter of production was 4.32 kgCO2e/hl in HY24, a reduction of approximately 4% from HY23. In Water Stewardship, our water use efficiency ratio improved to 2.50 hl per hl in HY24 versus 2.54 hl per hl in HY23, progressing towards our ambition to reach 2.50 hl per hl on an annual basis by 2025.
Creating a future with more cheers
In the first half of this year, our business delivered EBITDA growth of 7.8% with margin expansion of 165bps, while we continued to invest for the long-term in our brands, facilities and digital initiatives. Our nominal EBITDA growth and the continued optimization of our business drove strong operating leverage, resulting in an Underlying EPS increase of 21% in HY24. Our performance is made possible by the dedication and hard work of our people and we take this opportunity to thank all our colleagues globally for their passion and commitment. The beer category is large and growing, and our unique global leadership advantages, replicable growth drivers and superior profitability position us well to deliver on our purpose to create a future with more cheers.
2024 Outlook
- Overall Performance: We expect our EBITDA to grow in line with our medium-term outlook of between 4-8%. The outlook for FY24 reflects our current assessment of inflation and other macroeconomic conditions.
-
Net Finance Costs: Net pension interest expenses and accretion expenses are expected to be in the range of 220 to
250 million USD per quarter, depending on currency and interest rate fluctuations. We expect the average gross debt coupon in FY24 to be approximately 4%. - Effective Tax Rates (ETR): We expect the normalized ETR in FY24 to be in the range of 27% to 29%. The ETR outlook does not consider the impact of potential future changes in legislation.
-
Net Capital Expenditure: We expect net capital expenditure of between 4.0 and
4.5 billion USD in FY24.
|
Figure 1. Consolidated performance (million USD) |
||||||
|
2Q23 |
2Q24 |
Organic |
||||
|
growth |
||||||
|
Total Volumes (thousand hls) |
147 583 |
146 302 |
-0.8% |
|||
|
|
128 750 |
126 926 |
-1.3% |
|||
|
Non-beer volumes |
17 636 |
18 235 |
3.4% |
|||
|
Third party products |
1 197 |
1 140 |
-4.7% |
|||
|
Revenue |
15 120 |
15 333 |
2.7% |
|||
|
Gross profit |
8 101 |
8 567 |
7.0% |
|||
|
Gross margin |
53.6% |
55.9% |
224bps |
|||
|
Normalized EBITDA |
4 909 |
5 302 |
10.2% |
|||
|
Normalized EBITDA margin |
32.5% |
34.6% |
236bps |
|||
|
Normalized EBIT |
3 569 |
3 905 |
11.9% |
|||
|
Normalized EBIT margin |
23.6% |
25.5% |
209bps |
|||
|
|
||||||
|
Profit attributable to equity holders of |
339 |
1 472 |
||||
|
Underlying profit attributable to equity holders of |
1 452 |
1 811 |
||||
|
|
||||||
|
Earnings per share (USD) |
0.17 |
0.73 |
||||
|
Underlying earnings per share (USD) |
0.72 |
0.90 |
|
|||
|
HY23 |
HY24 |
Organic |
||||
|
growth |
||||||
|
Total Volumes (thousand hls) |
288 131 |
285 837 |
-0.7% |
|||
|
|
249 810 |
246 313 |
-1.3% |
|||
|
Non-beer volumes |
36 223 |
37 465 |
3.5% |
|||
|
Third party products |
2 098 |
2 059 |
-1.8% |
|||
|
Revenue |
29 333 |
29 880 |
2.7% |
|||
|
Gross profit |
15 796 |
16 461 |
4.9% |
|||
|
Gross margin |
53.9% |
55.1% |
117bps |
|||
|
Normalized EBITDA |
9 668 |
10 288 |
7.8% |
|||
|
Normalized EBITDA margin |
33.0% |
34.4% |
165bps |
|||
|
Normalized EBIT |
7 072 |
7 547 |
8.5% |
|||
|
Normalized EBIT margin |
24.1% |
25.3% |
135bps |
|||
|
|
||||||
|
Profit attributable to equity holders of |
1 977 |
2 564 |
||||
|
Underlying profit attributable to equity holders of |
2 762 |
3 320 |
||||
|
|
||||||
|
Earnings per share (USD) |
0.98 |
1.28 |
||||
|
Underlying earnings per share (USD) |
1.37 |
1.66 |
|
|||
|
Figure 2. Volumes (thousand hls) |
||||||||||||
|
2Q23 |
Scope |
Organic |
2Q24 |
Organic growth |
||||||||
|
growth |
Total |
Own beer |
||||||||||
|
|
23 542 |
-156 |
- 747 |
22 639 |
-3.2% |
-3.9% |
||||||
|
Middle |
37 893 |
-4 |
493 |
38 381 |
1.3% |
1.8% |
||||||
|
|
35 737 |
- |
232 |
35 969 |
0.6% |
-0.9% |
||||||
|
EMEA |
22 884 |
- |
968 |
23 852 |
4.2% |
3.8% |
||||||
|
|
27 475 |
- |
-2 076 |
25 399 |
-7.6% |
-7.6% |
||||||
|
Global Export and Holding Companies |
51 |
- |
11 |
62 |
21.2% |
- |
||||||
|
AB InBev Worldwide |
147 583 |
- 161 |
-1 121 |
146 302 |
-0.8% |
-1.3% |
||||||
|
HY23 |
Scope |
Organic |
HY24 |
Organic growth |
||||||||
|
growth |
Total |
Own beer |
||||||||||
|
|
47 395 |
-311 |
-3 092 |
43 992 |
-6.6% |
-7.5% |
||||||
|
Middle |
72 164 |
-9 |
1 916 |
74 072 |
2.7% |
3.0% |
||||||
|
|
76 023 |
- |
292 |
76 315 |
0.4% |
-0.8% |
||||||
|
EMEA |
42 842 |
- |
2 040 |
44 882 |
4.8% |
4.3% |
||||||
|
|
49 589 |
- |
-3 145 |
46 444 |
-6.3% |
-6.3% |
||||||
|
Global Export and Holding Companies |
117 |
- |
15 |
132 |
12.5% |
- |
||||||
|
AB InBev Worldwide |
288 131 |
- 320 |
-1 973 |
285 837 |
-0.7% |
-1.3% |
||||||
Key Market Performances
-
Operating performance:
- 2Q24: Revenue declined by 0.6% with revenue per hl increasing by 2.2% driven by revenue management initiatives and premiumization. Sales-to-wholesalers (STWs) declined by 2.7% and sales-to-retailers (STRs) were down by 4.1%, estimated to be in-line with the industry as we cycled a challenging comparable in April but gained volume share of the industry in May and June. EBITDA grew by 17.5% with a margin improvement of approximately 500bps, driven by productivity initiatives and SG&A efficiencies.
- HY24: Revenue declined by 5.0%, with revenue per hl increasing by 1.6%. Our STWs declined by 6.5% and STRs were down by 8.6%. EBITDA declined by 2.3%.
-
Commercial highlights: The beer industry remained resilient this quarter, gaining share of total alcohol by value in the off-premise, according to Circana, although the alcohol category was negatively impacted by the phasing of key holidays and adverse weather. Our beer market share was estimated to be flattish in 2Q24, with our improved trend driven by
Michelob Ultra andBusch Light , which were two of the top three volume share gainers in the industry. In Beyond Beer, our spirits-based ready-to-drink portfolio delivered volume growth in the high-teens, outperforming the industry. We continue to invest in and make progress on our commercial strategy to rebalance our portfolio with our above core beer and Beyond Beer brands generating approximately 45% of our revenue in 2Q24.
-
Operating performance:
- 2Q24: Revenue increased by mid-single digits, with low-single digit revenue per hl growth driven by revenue management initiatives.Volumes grew by mid-single digits, outperforming the industry. EBITDA grew by low-teens with continued margin expansion.
- HY24: Revenue grew by mid-single digits with revenue per hl growth of low-single digits. Volumes increased by mid-single digits, outperforming the industry. EBITDA grew by high-single digits with margin expansion.
-
Commercial highlights: Our core portfolio continued to outperform this quarter, delivering mid-single digit volume growth. Our above core portfolio delivered mid-single digit revenue growth, led by the strong performance of Modelo and Pacifico. We continued to progress our digital initiatives, with
BEES Marketplace growing GMV by 15% versus 2Q23, and our digital DTC platform, TaDa Delivery, generating over 1.1 million orders, a 20% increase versus 2Q23.
-
Operating performance:
- 2Q24: Revenue grew by mid-teens, with low-teens revenue per hl growth, driven by pricing actions and revenue management initiatives. Volumes grew by low-single digits, with our portfolio continuing to gain share of total alcohol. EBITDA grew by low-twenties with margin expansion.
- HY24: Revenue grew by mid-teens with revenue per hl growth of low-teens. Volumes increased by mid-single digits. EBITDA grew by high-teens with margin expansion.
- Commercial highlights: Our premium and super premium brands led our performance in 2Q24, delivering high-twenties volume growth and driving record high second quarter volumes. Our mainstream beer portfolio delivered low-single digit volume growth with a strong performance from Aguila.
-
Operating performance:
- 2Q24: Revenue grew by 8.0% with revenue per hl growth of 3.7% driven by revenue management initiatives. Total volumes grew by 4.1%, with beer volumes increasing by 2.9%. Non-beer volumes increased by 7.7%. EBITDA increased by 28.0% with margin expansion of 469bps.
- HY24: Total volumes grew by 4.2%with beer volumes up by 3.2% and non-beer volumes up by 7.1%. Revenue grew by 6.9% with a revenue per hl increase of 2.5%. EBITDA grew by 21.9% with 387bps of margin expansion.
-
Commercial highlights: Our premium and super premium brands continued to outperform the industry, delivering low-teens volume growth led by Corona and Spaten, and driving record high second quarter total volumes. Our core beer portfolio continued to grow, delivering a low-single digit volume increase. Non-beer performance was led by our low- and no-sugar portfolio, which grew volumes in the mid-teens. We continued to progress our digital initiatives, with
BEES Marketplace growing GMV by 32% versus 2Q23, and our digital DTC platform, Zé Delivery, generating over 16 million orders in 2Q24, a 13% increase versus 2Q23.
-
Operating performance:
- 2Q24: Revenue increased by low-single digits driven by volume growth of low-single digits, outperforming a soft industry according to our estimates. Revenue per hl declined by low-single digits, impacted by negative geographic mix and phasing of promotional activities. EBITDA grew by high-single digits with margin recovery.
- HY24: Revenue increased by mid-single digits with revenue per hl growth of low-single digits. Volume grew by low-single digits, outperforming the industry according to our estimates. EBITDA grew by low-twenties with margin recovery driven by top-line growth and cost efficiencies.
-
Commercial highlights: We continued to premiumize our portfolio in
Europe , with our premium and super premium portfolio making up approximately 57% of our revenue in 2Q24. Our megabrands continued to drive our growth this quarter, led by Corona, which grew volume by double-digits, and Stella Artois, which successfully activated the Perfect Serve campaign at the Roland Garros andWimbledon tennis tournaments.
-
Operating performance:
- 2Q24: Revenue increased by low-teens, with revenue per hl growth of high-single digits, driven by pricing actions and continued premiumization. Volumes grew by mid-single digits, continuing to outperform the industry in both beer and Beyond Beer according to our estimates. EBITDA grew by low-thirties with margin expansion.
- HY24: Revenue grew by mid-teens with high-single digit revenue per hl growth and a mid-single digit increase in volume, outperforming the industry in both beer and Beyond Beer according to our estimates. EBITDA increased by high-twenties with margin expansion.
- Commercial highlights: The momentum of our business continued, with our portfolio delivering another quarter of record high volumes and gaining share of both beer and total alcohol, according to our estimates. Our performance this quarter was led by our above core beer brands, which grew volumes by mid-teens driven by Corona and Stella Artois, and the continued volume growth of our core portfolio.
-
Operating performance:
- 2Q24: Top-line performance was impacted by a combination of a soft industry, which cycled channel reopening in 2Q23, and adverse weather in key regions of our footprint. Revenue declined by 15.2% with volumes declining by 10.4% and revenue per hl decreasing by 5.4%. EBITDA declined by 17.1% with margin contraction of approximately 80bps.
- HY24: Revenue declined by 9.4% with revenue per hl declining by 1.0% and volumes decreasing by 8.5%. EBITDA declined by 8.5% with margin expansion of 40bps.
- Commercial highlights: We continued to invest behind our commercial strategy, focused on premiumization, channel and geographic expansion, and digital transformation, even in the context of a soft start to the year for the industry. Our premium and super premium portfolio contributed approximately two-thirds of our revenue in HY24. The brand power of our portfolio combined with the long-term growth potential from further industry premiumization remains a compelling value creation opportunity. The roll out and adoption of the BEES platform continued, with BEES now present in 300 cities, enabling us to optimize our route to consumer and strengthen our customer relationships.
Highlights from our other markets
-
Canada : Revenue declined by mid-single digits this quarter with revenue per hl growth of low-single digits, driven by revenue management initiatives and continued premiumization. Volumes declined by high-single digits, impacted by a soft industry. -
Peru : Revenue declined by low-single digits this quarter with revenue per hl growth of mid-single digits, driven by revenue management initiatives. Volumes declined by high-single digits, outperforming a soft industry according to our estimates, which was negatively impacted by adverse weather and Easter shipment phasing. -
Ecuador : Revenue increased slightly in 2Q24 with volumes declining by low-single digits as the industry was negatively impacted by shipment phasing ahead of Easter and an April sales tax increase. Our core beer brands outperformed, growing revenue by mid-single digits. -
Argentina : Volumes declined by low-twenties in 2Q24 as overall consumer demand was impacted by inflationary pressures. For FY24, the definition of organic revenue growth inArgentina has been amended to cap the price growth to a maximum of 2% per month. Revenue was flattish on this basis. -
Africa excludingSouth Africa : InNigeria , our total volumes grew by mid-teens this quarter, cycling a soft industry in 2Q23. Revenue grew by strong double-digits, ahead of the industry according to our estimates, driven by revenue management initiatives in a highly inflationary environment. In our other markets inAfrica , we grew revenue in aggregate by high-single digits in 2Q24, driven byZambia ,Uganda andTanzania . -
South Korea : Revenue increased by high-teens in 2Q24 with revenue per hl growth of mid-teens, driven by revenue management initiatives and positive mix. Volumes grew by mid-single digits, outperforming the industry in both the on-premise and in-home channels, with performance led by our megabrands Cass, HANMAC and Stella Artois.
Consolidated Income Statement
|
Figure 3. Consolidated income statement (million USD) |
||||||
|
2Q23 |
2Q24 |
Organic |
||||
|
growth |
||||||
|
Revenue |
15 120 |
15 333 |
2.7% |
|||
|
Cost of sales |
-7 019 |
-6 766 |
2.2% |
|||
|
Gross profit |
8 101 |
8 567 |
7.0% |
|||
|
SG&A |
-4 707 |
-4 813 |
-2.3% |
|||
|
Other operating income/(expenses) |
175 |
151 |
-20.8% |
|||
|
Normalized profit from operations (normalized EBIT) |
3 569 |
3 905 |
11.9% |
|||
|
Non-underlying items above EBIT (incl. impairment losses) |
-60 |
-90 |
||||
|
Net finance income/(cost) |
-1 283 |
-1 170 |
||||
|
Non-underlying net finance income/(cost) |
-1 078 |
- 221 |
||||
|
Share of results of associates |
55 |
79 |
||||
|
Income tax expense |
-595 |
-752 |
||||
|
Profit |
607 |
1 751 |
||||
|
Profit attributable to non-controlling interest |
269 |
279 |
||||
|
Profit attributable to equity holders of |
339 |
1 472 |
||||
|
|
||||||
|
Normalized EBITDA |
4 909 |
5 302 |
10.2% |
|||
|
Underlying profit attributable to equity holders of |
1 452 |
1 811 |
||||
|
. |
||||||
|
HY23 |
HY24 |
Organic |
||||
|
growth |
||||||
|
Revenue |
29 333 |
29 880 |
2.7% |
|||
|
Cost of sales |
-13 536 |
-13 419 |
-0.1% |
|||
|
Gross profit |
15 796 |
16 461 |
4.9% |
|||
|
SG&A |
-9 051 |
-9 248 |
-1.9% |
|||
|
Other operating income/(expenses) |
327 |
334 |
-2.7% |
|||
|
Normalized profit from operations (normalized EBIT) |
7 072 |
7 547 |
8.5% |
|||
|
Non-underlying items above EBIT (incl. impairment losses) |
-107 |
-119 |
||||
|
Net finance income/(cost) |
-2 520 |
-2 357 |
||||
|
Non-underlying net finance income/(cost) |
-703 |
-530 |
||||
|
Share of results of associates |
105 |
137 |
||||
|
Non-underlying share of results of associates |
- |
104 |
||||
|
Income tax expense |
-1 192 |
-1 546 |
||||
|
Profit |
2 655 |
3 236 |
||||
|
Profit attributable to non-controlling interest |
678 |
672 |
||||
|
Profit attributable to equity holders of |
1 977 |
2 564 |
||||
|
|
||||||
|
Normalized EBITDA |
9 668 |
10 288 |
7.8% |
|||
|
Underlying profit attributable to equity holders of |
2 762 |
3 320 |
||||
|
. |
|
Non-underlying items above EBIT & Non-underlying share of results of associates
|
Figure 4. Non-underlying items above EBIT & Non-underlying share of results of associates (million USD) |
||||||||
|
2Q23 |
2Q24 |
HY23 |
HY24 |
|||||
|
Restructuring |
-22 |
-28 |
-50 |
-59 |
||||
|
Business and asset disposal (incl. impairment losses) |
-19 |
-62 |
-38 |
-60 |
||||
|
Claims and legal costs |
-19 |
- |
-19 |
- |
||||
|
Non-underlying items in EBIT |
-60 |
-90 |
-107 |
-119 |
||||
|
Non-underlying share of results of associates |
- |
- |
- |
104 |
||||
Non-underlying share of results from associates of HY24 includes the impact from our associate Anadolu Efes’ adoption of IAS 29 hyperinflation accounting on their 2023 results.
Net finance income/(cost)
|
Figure 5. Net finance income/(cost) (million USD) |
||||||||
|
2Q23 |
2Q24 |
HY23 |
HY24 |
|||||
|
Net interest expense |
-824 |
-746 |
-1 630 |
-1 460 |
||||
|
Net interest on net defined benefit liabilities |
-21 |
-23 |
-42 |
-45 |
||||
|
Accretion expense |
-202 |
-191 |
-385 |
-382 |
||||
|
Net interest income on Brazilian tax credits |
47 |
25 |
78 |
61 |
||||
|
Other financial results |
-283 |
-235 |
-540 |
-530 |
||||
|
Net finance income/(cost) |
-1 283 |
-1 170 |
-2 520 |
-2 357 |
||||
Non-underlying net finance income/(cost)
|
Figure 6. Non-underlying net finance income/(cost) (million USD) |
||||||||
|
2Q23 |
2Q24 |
HY23 |
HY24 |
|||||
|
Mark-to-market |
-1 078 |
-264 |
-703 |
-507 |
||||
|
Gain/(loss) on bond redemption and other |
- |
43 |
- |
-23 |
||||
|
Non-underlying net finance income/(cost) |
-1 078 |
-221 |
-703 |
-530 |
||||
Non-underlying net finance cost in HY24 includes mark-to-market losses on derivative instruments entered into in order to hedge our share-based payment programs and shares issued in relation to the combination with Grupo Modelo and
The number of shares covered by the hedging of our share-based payment program, the deferred share instrument and the restricted shares are shown in figure 7, together with the opening and closing share prices.
|
Figure 7. Non-underlying equity derivative instruments |
||||||||
|
2Q23 |
2Q24 |
HY23 |
HY24 |
|||||
|
Share price at the start of the period (Euro) |
61.33 |
56.46 |
56.27 |
58.42 |
||||
|
Share price at the end of the period (Euro) |
51.83 |
54.12 |
51.83 |
54.12 |
||||
|
Number of equity derivative instruments at the end of the period (millions) |
100.5 |
100.5 |
100.5 |
100.5 |
||||
Income tax expense
|
Figure 8. Income tax expense (million USD) |
||||||||
|
2Q23 |
2Q24 |
HY23 |
HY24 |
|||||
|
Income tax expense |
595 |
752 |
1 192 |
1 546 |
||||
|
Effective tax rate |
51.9% |
31.0% |
31.9% |
34.1% |
||||
|
Normalized effective tax rate |
27.8% |
27.4% |
27.3% |
27.2% |
||||
The 2Q23 and 2Q24 effective tax rates were negatively impacted by non-deductible losses from derivatives related to the hedging of share-based payment programs and of the shares issued in a transaction related to the combination with Grupo Modelo and
Furthermore, the HY24 effective tax rate includes
|
Figure 9. Underlying Profit attributable to equity holders of |
||||||||
|
2Q23 |
2Q24 |
HY23 |
HY24 |
|||||
|
Profit attributable to equity holders of |
339 |
1 472 |
1 977 |
2 564 |
||||
|
Net impact of non-underlying items on profit |
1 092 |
313 |
750 |
675 |
||||
|
Hyperinflation impacts in underlying profit |
22 |
26 |
35 |
81 |
||||
|
Underlying profit attributable to equity holders of |
1 452 |
1 811 |
2 762 |
3 320 |
||||
Basic and underlying EPS
|
Figure 10. Earnings per share (USD) |
||||||||
|
2Q23 |
2Q24 |
HY23 |
HY24 |
|||||
|
Basic EPS |
0.17 |
0.73 |
0.98 |
1.28 |
||||
|
Net impact of non-underlying items on profit |
0.53 |
0.16 |
0.36 |
0.34 |
||||
|
Hyperinflation impacts in EPS |
0.01 |
0.01 |
0.02 |
0.04 |
||||
|
Underlying EPS |
0.72 |
0.90 |
1.37 |
1.66 |
||||
|
Weighted average number of ordinary and restricted shares (million) |
2 016 |
2 005 |
2 016 |
2 005 |
||||
|
Figure 11. Key components - Underlying EPS in USD |
||||||||
|
2Q23 |
2Q24 |
HY23 |
HY24 |
|||||
|
Normalized EBIT before hyperinflation |
1.78 |
1.96 |
3.54 |
3.78 |
||||
|
Hyperinflation impacts in normalized EBIT |
-0.01 |
-0.01 |
-0.03 |
-0.02 |
||||
|
Normalized EBIT |
1.77 |
1.95 |
3.51 |
3.76 |
||||
|
Net finance cost |
-0.64 |
-0.58 |
-1.25 |
-1.18 |
||||
|
Income tax expense |
-0.31 |
-0.37 |
-0.62 |
-0.70 |
||||
|
Associates & non-controlling interest |
-0.11 |
-0.10 |
-0.29 |
-0.27 |
||||
|
Hyperinflation impacts in EPS |
0.01 |
0.01 |
0.02 |
0.04 |
||||
|
Underlying EPS |
0.72 |
0.90 |
1.37 |
1.66 |
||||
|
Weighted average number of ordinary and restricted shares (million) |
2 016 |
2 005 |
2 016 |
2 005 |
||||
Reconciliation between normalized EBITDA and profit attributable to equity holders
|
Figure 12. Reconciliation of normalized EBITDA to profit attributable to equity holders of |
||||||||
|
2Q23 |
2Q24 |
HY23 |
HY24 |
|||||
|
Profit attributable to equity holders of |
339 |
1 472 |
1 977 |
2 564 |
||||
|
Non-controlling interests |
269 |
279 |
678 |
672 |
||||
|
Profit |
607 |
1 751 |
2 655 |
3 236 |
||||
|
Income tax expense |
595 |
752 |
1 192 |
1 546 |
||||
|
Share of result of associates |
-55 |
-79 |
-105 |
-137 |
||||
|
Non-underlying share of results of associates |
- |
- |
- |
- 104 |
||||
|
Net finance (income)/cost |
1 283 |
1 170 |
2 520 |
2 357 |
||||
|
Non-underlying net finance (income)/cost |
1 078 |
221 |
703 |
530 |
||||
|
Non-underlying items above EBIT (incl. impairment losses) |
60 |
90 |
107 |
119 |
||||
|
Normalized EBIT |
3 569 |
3 905 |
7 072 |
7 547 |
||||
|
Depreciation, amortization and impairment |
1 340 |
1 397 |
2 596 |
2 741 |
||||
|
Normalized EBITDA |
4 909 |
5 302 |
9 668 |
10 288 |
||||
Normalized EBITDA and normalized EBIT are measures utilized by
Normalized EBITDA is calculated excluding the following effects from profit attributable to equity holders of
Normalized EBITDA and normalized EBIT are not accounting measures under IFRS and should not be considered as an alternative to profit attributable to equity holders as a measure of operational performance, or an alternative to cash flow as a measure of liquidity. Normalized EBITDA and normalized EBIT do not have a standard calculation method and AB InBev’s definition of normalized EBITDA and normalized EBIT may not be comparable to that of other companies.
Financial position
|
Figure 13. Cash Flow Statement (million USD) |
||||
|
HY23 |
HY24 |
|||
|
Operating activities |
||||
|
Profit of the period |
2 655 |
3 236 |
||
|
Interest, taxes and non-cash items included in profit |
7 512 |
7 588 |
||
|
Cash flow from operating activities before changes in working capital and use of provisions |
10 167 |
10 824 |
||
|
|
||||
|
Change in working capital |
-4 615 |
-4 170 |
||
|
Pension contributions and use of provisions |
- 192 |
- 251 |
||
|
Interest and taxes (paid)/received |
-3 806 |
-3 958 |
||
|
Dividends received |
43 |
123 |
||
|
Cash flow from/(used in) operating activities |
1 597 |
2 568 |
||
|
|
||||
|
Investing activities |
||||
|
Net capex |
-2 063 |
-1 684 |
||
|
Sale/(acquisition) of subsidiaries, net of cash disposed/ acquired of |
- 8 |
- 19 |
||
|
Net proceeds from sale/(acquisition) of other assets |
- 18 |
- 29 |
||
|
Cash flow from/(used in) investing activities |
-2 089 |
-1 732 |
||
|
|
||||
|
Financing activities |
||||
|
Net (repayments of) / proceeds from borrowings |
155 |
1 124 |
||
|
Dividends paid |
-1 923 |
-2 142 |
||
|
Share buyback |
- |
- 838 |
||
|
Payment of lease liabilities |
- 359 |
- 406 |
||
|
Derivative financial instruments |
- 360 |
- 172 |
||
|
Sale/(acquisition) of non-controlling interests |
- 3 |
- 414 |
||
|
Other financing cash flows |
- 304 |
- 465 |
||
|
Cash flow from/(used in) financing activities |
-2 795 |
-3 313 |
||
|
. |
||||
|
Net increase/(decrease) in cash and cash equivalents |
-3 287 |
-2 476 |
||
HY24 recorded a decrease in cash and cash equivalents of 2
-
Our cash flow from operating activities reached 2
568 million USD in HY24 compared to 1597 million USD in HY23. The increase was driven by increased profit for the period and changes in working capital for HY24 compared to HY23. Changes in working capital in the first half of 2024 and 2023 reflect higher working capital levels at the end of June than at year-end as a result of seasonality. -
Our cash outflow from investing activities was 1
732 million USD in HY24 compared to a cash outflow of 2089 million USD in HY23. The decrease in the cash outflow was mainly due to lower net capital expenditures in HY24 compared to HY23. Out of the total HY24 capital expenditures, approximately 42% was used to improve the company’s production facilities while 40% was used for logistics and commercial investments and 18% was used for the purchase of hardware and software and improving administrative capabilities. -
Our cash outflow from financing activities amounted to 3
313 million USD in HY24, as compared to a cash outflow of 2795 million USD in HY23. The increase in the cash outflow versus HY23 was primarily driven by the completion of our1 billion USD share buyback program, a0.2 billion USD direct share buyback from Altria, and the acquisition of additional non-controlling interests in CerveceríaNacional Dominicana S.A. for a net consideration of0.3 billion US dollar .
Our net debt increased to
Our net debt to normalized EBITDA ratio was 3.42x as of
We continue to proactively manage our debt portfolio. 99% of our bond portfolio holds a fixed-interest rate, 43% is denominated in currencies other than USD and maturities are well-distributed across the next several years.
As of
Notes
To facilitate the understanding of AB InBev’s underlying performance, the analyses of growth, including all comments in this press release, unless otherwise indicated, are based on organic growth and normalized numbers. In other words, financials are analyzed eliminating the impact of changes in currencies on translation of foreign operations, and scope changes. For FY24, the definition of organic revenue growth has been amended to cap the price growth in
Legal disclaimer
This release contains “forward-looking statements”. These statements are based on the current expectations and views of future events and developments of the management of
Conference call and webcast
Investor Conference call and webcast on Thursday,
Registration details:
Webcast (listen-only mode):
To join by phone, please use one of the following two phone numbers:
Toll-Free: +1-877-407-8029
Toll: +1-201-689-8029
About
Annex 1: Segment reporting (2Q)
|
AB InBev Worldwide |
2Q23 |
Scope |
Currency Translation |
Organic Growth |
2Q24 |
Organic Growth |
||||||
|
Total volumes (thousand hls) |
147 583 |
-161 |
- |
-1 121 |
146 302 |
-0.8% |
||||||
|
of which |
128 750 |
-155 |
- |
-1 669 |
126 926 |
-1.3% |
||||||
|
Revenue |
15 120 |
422 |
-622 |
413 |
15 333 |
2.7% |
||||||
|
Cost of sales |
-7 019 |
-395 |
493 |
155 |
-6 766 |
2.2% |
||||||
|
Gross profit |
8 101 |
27 |
-128 |
568 |
8 567 |
7.0% |
||||||
|
SG&A |
-4 707 |
-283 |
286 |
-108 |
-4 813 |
-2.3% |
||||||
|
Other operating income/(expenses) |
175 |
12 |
2 |
-38 |
151 |
-20.8% |
||||||
|
Normalized EBIT |
3 569 |
-244 |
159 |
421 |
3 905 |
11.9% |
||||||
|
Normalized EBITDA |
4 909 |
-173 |
67 |
499 |
5 302 |
10.2% |
||||||
|
Normalized EBITDA margin |
32.5% |
34.6% |
236bps |
|||||||||
|
|
||||||||||||
|
|
2Q23 |
Scope |
Currency Translation |
Organic Growth |
2Q24 |
Organic Growth |
||||||
|
Total volumes (thousand hls) |
23 542 |
-156 |
- |
-747 |
22 639 |
-3.2% |
||||||
|
Revenue |
3 953 |
-38 |
-1 |
-51 |
3 864 |
-1.3% |
||||||
|
Cost of sales |
-1 745 |
22 |
- |
117 |
-1 606 |
6.8% |
||||||
|
Gross profit |
2 208 |
-16 |
- |
66 |
2 258 |
3.0% |
||||||
|
SG&A |
-1 215 |
4 |
- |
110 |
-1 101 |
9.1% |
||||||
|
Other operating income/(expenses) |
10 |
- |
- |
-6 |
4 |
- |
||||||
|
Normalized EBIT |
1 003 |
-12 |
- |
169 |
1 161 |
17.1% |
||||||
|
Normalized EBITDA |
1 189 |
-13 |
- |
162 |
1 338 |
13.8% |
||||||
|
Normalized EBITDA margin |
30.1% |
34.6% |
458bps |
|||||||||
|
|
||||||||||||
|
Middle |
2Q23 |
Scope |
Currency Translation |
Organic Growth |
2Q24 |
Organic Growth |
||||||
|
Total volumes (thousand hls) |
37 893 |
-4 |
- |
493 |
38 381 |
1.3% |
||||||
|
Revenue |
4 084 |
-7 |
205 |
240 |
4 522 |
5.9% |
||||||
|
Cost of sales |
-1 571 |
-6 |
-67 |
51 |
-1 593 |
3.2% |
||||||
|
Gross profit |
2 513 |
-13 |
138 |
292 |
2 929 |
11.7% |
||||||
|
SG&A |
-985 |
- |
-51 |
-64 |
-1 100 |
-6.5% |
||||||
|
Other operating income/(expenses) |
10 |
6 |
1 |
-5 |
11 |
- |
||||||
|
Normalized EBIT |
1 538 |
-8 |
88 |
223 |
1 841 |
14.5% |
||||||
|
Normalized EBITDA |
1 916 |
-7 |
104 |
206 |
2 219 |
10.8% |
||||||
|
Normalized EBITDA margin |
46.9% |
49.1% |
215bps |
|||||||||
|
|
||||||||||||
|
|
2Q23 |
Scope |
Currency Translation |
Organic Growth |
2Q24 |
Organic Growth |
||||||
|
Total volumes (thousand hls) |
35 737 |
- |
- |
232 |
35 969 |
0.6% |
||||||
|
Revenue |
2 742 |
463 |
-588 |
168 |
2 785 |
6.1% |
||||||
|
Cost of sales |
-1 423 |
-401 |
424 |
-27 |
-1 427 |
-1.9% |
||||||
|
Gross profit |
1 319 |
63 |
-164 |
141 |
1 359 |
10.5% |
||||||
|
SG&A |
-926 |
-311 |
285 |
-24 |
-976 |
-2.4% |
||||||
|
Other operating income/(expenses) |
81 |
4 |
-5 |
19 |
99 |
22.7% |
||||||
|
Normalized EBIT |
475 |
-244 |
115 |
136 |
482 |
30.2% |
||||||
|
Normalized EBITDA |
737 |
-172 |
31 |
154 |
750 |
21.7% |
||||||
|
Normalized EBITDA margin |
26.9% |
26.9% |
380bps |
|
EMEA |
2Q23 |
Scope |
Currency Translation |
Organic Growth |
2Q24 |
Organic Growth |
||||||
|
Total volumes (thousand hls) |
22 884 |
- |
- |
968 |
23 852 |
4.2% |
||||||
|
Revenue |
2 248 |
5 |
-177 |
226 |
2 301 |
10.0% |
||||||
|
Cost of sales |
-1 207 |
-4 |
122 |
-89 |
-1 179 |
-7.4% |
||||||
|
Gross profit |
1 041 |
- |
-56 |
137 |
1 122 |
13.1% |
||||||
|
SG&A |
-662 |
-6 |
34 |
-57 |
-691 |
-8.6% |
||||||
|
Other operating income/(expenses) |
47 |
1 |
- |
-14 |
34 |
-28.3% |
||||||
|
Normalized EBIT |
426 |
-5 |
-22 |
66 |
465 |
15.6% |
||||||
|
Normalized EBITDA |
680 |
-5 |
-40 |
86 |
721 |
12.7% |
||||||
|
Normalized EBITDA margin |
30.3% |
31.3% |
73bps |
|||||||||
|
|
||||||||||||
|
|
2Q23 |
Scope |
Currency Translation |
Organic Growth |
2Q24 |
Organic Growth |
||||||
|
Total volumes (thousand hls) |
27 475 |
- |
- |
-2 076 |
25 399 |
-7.6% |
||||||
|
Revenue |
1 973 |
-1 |
-61 |
-163 |
1 749 |
-8.2% |
||||||
|
Cost of sales |
-927 |
-6 |
27 |
85 |
-821 |
9.1% |
||||||
|
Gross profit |
1 046 |
-7 |
-33 |
-77 |
928 |
-7.4% |
||||||
|
SG&A |
-584 |
-8 |
18 |
24 |
-549 |
4.1% |
||||||
|
Other operating income/(expenses) |
21 |
1 |
-1 |
10 |
30 |
44.7% |
||||||
|
Normalized EBIT |
483 |
-14 |
-16 |
-43 |
410 |
-9.2% |
||||||
|
Normalized EBITDA |
645 |
-15 |
-22 |
-38 |
570 |
-6.0% |
||||||
|
Normalized EBITDA margin |
32.7% |
32.6% |
78bps |
|||||||||
|
|
||||||||||||
|
Global Export and Holding Companies |
2Q23 |
Scope |
Currency Translation |
Organic Growth |
2Q24 |
Organic Growth |
||||||
|
Total volumes (thousand hls) |
51 |
- |
- |
11 |
62 |
21.2% |
||||||
|
Revenue |
119 |
- |
- |
-8 |
112 |
-6.4% |
||||||
|
Cost of sales |
-147 |
- |
-13 |
18 |
-141 |
12.1% |
||||||
|
Gross profit |
-27 |
- |
-12 |
10 |
-30 |
37.2% |
||||||
|
SG&A |
-336 |
38 |
-1 |
-97 |
-396 |
-32.7% |
||||||
|
Other operating income/(expenses) |
7 |
- |
7 |
-42 |
-28 |
- |
||||||
|
Normalized EBIT |
-357 |
38 |
-6 |
-129 |
-453 |
-40.4% |
||||||
|
Normalized EBITDA |
-257 |
38 |
-6 |
-70 |
-295 |
-32.1% |
||||||
Annex 2: Segment reporting (HY)
|
AB InBev Worldwide |
HY23 |
Scope |
Currency Translation |
Organic Growth |
HY24 |
Organic Growth |
||||||
|
Total volumes (thousand hls) |
288 131 |
- 320 |
- |
-1 973 |
285 837 |
-0.7% |
||||||
|
of which |
249 810 |
- 304 |
- |
-3 192 |
246 313 |
-1.3% |
||||||
|
Revenue |
29 333 |
1 732 |
-1 970 |
785 |
29 880 |
2.7% |
||||||
|
Cost of sales |
-13 536 |
-1 019 |
1 148 |
- 11 |
-13 419 |
-0.1% |
||||||
|
Gross profit |
15 796 |
712 |
- 822 |
774 |
16 461 |
4.9% |
||||||
|
SG&A |
-9 051 |
- 672 |
646 |
- 171 |
-9 248 |
-1.9% |
||||||
|
Other operating income/(expenses) |
327 |
11 |
5 |
-9 |
334 |
-2.7% |
||||||
|
Normalized EBIT |
7 072 |
51 |
- 170 |
594 |
7 547 |
8.5% |
||||||
|
Normalized EBITDA |
9 668 |
218 |
- 352 |
755 |
10 288 |
7.8% |
||||||
|
Normalized EBITDA margin |
33.0% |
34.4% |
165bps |
|||||||||
|
|
||||||||||||
|
|
HY23 |
Scope |
Currency Translation |
Organic Growth |
HY24 |
Organic Growth |
||||||
|
Total volumes (thousand hls) |
47 395 |
- 311 |
- |
-3 092 |
43 992 |
-6.6% |
||||||
|
Revenue |
7 926 |
- 75 |
1 |
- 396 |
7 457 |
-5.0% |
||||||
|
Cost of sales |
-3 420 |
42 |
- 1 |
228 |
-3 150 |
6.7% |
||||||
|
Gross profit |
4 506 |
- 32 |
1 |
- 169 |
4 307 |
-3.8% |
||||||
|
SG&A |
-2 354 |
21 |
- 1 |
147 |
-2 186 |
6.3% |
||||||
|
Other operating income/(expenses) |
18 |
- |
- |
-26 |
-8 |
- |
||||||
|
Normalized EBIT |
2 171 |
- 11 |
- |
- 48 |
2 112 |
-2.2% |
||||||
|
Normalized EBITDA |
2 539 |
- 13 |
- |
- 62 |
2 464 |
-2.5% |
||||||
|
Normalized EBITDA margin |
32.0% |
33.0% |
88bps |
|||||||||
|
Middle |
HY23 |
Scope |
Currency Translation |
Organic Growth |
HY24 |
Organic Growth |
||||||
|
Total volumes (thousand hls) |
72 164 |
- 9 |
- |
1 916 |
74 072 |
2.7% |
||||||
|
Revenue |
7 573 |
- 12 |
494 |
519 |
8 574 |
6.9% |
||||||
|
Cost of sales |
-2 926 |
- 13 |
- 182 |
- 58 |
-3 179 |
-2.0% |
||||||
|
Gross profit |
4 646 |
- 24 |
312 |
461 |
5 395 |
10.0% |
||||||
|
SG&A |
-1 863 |
4 |
- 122 |
- 84 |
-2 065 |
-4.5% |
||||||
|
Other operating income/(expenses) |
8 |
13 |
2 |
- |
23 |
- |
||||||
|
Normalized EBIT |
2 792 |
- 8 |
192 |
377 |
3 353 |
13.5% |
||||||
|
Normalized EBITDA |
3 494 |
- |
237 |
374 |
4 105 |
10.7% |
||||||
|
Normalized EBITDA margin |
46.1% |
47.9% |
166bps |
|||||||||
|
|
||||||||||||
|
|
HY23 |
Scope |
Currency Translation |
Organic Growth |
HY24 |
Organic Growth |
||||||
|
Total volumes (thousand hls) |
76 023 |
- |
- |
292 |
76 315 |
0.4% |
||||||
|
Revenue |
5 849 |
1 813 |
-1 971 |
327 |
6 018 |
5.6% |
||||||
|
Cost of sales |
-2 949 |
-1 031 |
1 026 |
- 59 |
-3 013 |
-2.0% |
||||||
|
Gross profit |
2 900 |
782 |
- 944 |
267 |
3 005 |
9.1% |
||||||
|
SG&A |
-1 804 |
- 721 |
663 |
- 55 |
-1 917 |
-2.9% |
||||||
|
Other operating income/(expenses) |
171 |
-5 |
9 |
40 |
215 |
23.1% |
||||||
|
Normalized EBIT |
1 268 |
57 |
- 273 |
252 |
1 304 |
20.5% |
||||||
|
Normalized EBITDA |
1 766 |
220 |
- 449 |
298 |
1 834 |
17.3% |
||||||
|
Normalized EBITDA margin |
30.2% |
30.5% |
326bps |
|
EMEA |
HY23 |
Scope |
Currency Translation |
Organic Growth |
HY24 |
Organic Growth |
||||||
|
Total volumes (thousand hls) |
42 842 |
- |
- |
2 040 |
44 882 |
4.8% |
||||||
|
Revenue |
4 070 |
6 |
- 372 |
524 |
4 228 |
12.8% |
||||||
|
Cost of sales |
-2 210 |
- 6 |
249 |
- 247 |
-2 215 |
-11.2% |
||||||
|
Gross profit |
1 860 |
1 |
- 123 |
276 |
2 014 |
14.9% |
||||||
|
SG&A |
-1 307 |
- 7 |
70 |
- 61 |
-1 305 |
-4.7% |
||||||
|
Other operating income/(expenses) |
83 |
1 |
-3 |
-2 |
79 |
-2.6% |
||||||
|
Normalized EBIT |
635 |
-5 |
-56 |
213 |
787 |
33.8% |
||||||
|
Normalized EBITDA |
1 142 |
- 5 |
- 95 |
248 |
1 290 |
21.8% |
||||||
|
Normalized EBITDA margin |
28.1% |
30.5% |
221bps |
|||||||||
|
|
||||||||||||
|
|
HY23 |
Scope |
Currency Translation |
Organic Growth |
HY24 |
Organic Growth |
||||||
|
Total volumes (thousand hls) |
49 589 |
- |
- |
-3 145 |
46 444 |
-6.3% |
||||||
|
Revenue |
3 679 |
-1 |
-123 |
-171 |
3 383 |
-4.6% |
||||||
|
Cost of sales |
-1 750 |
-13 |
55 |
124 |
-1 583 |
7.0% |
||||||
|
Gross profit |
1 929 |
-14 |
-68 |
-47 |
1 800 |
-2.5% |
||||||
|
SG&A |
-1 033 |
-8 |
35 |
12 |
-994 |
1.2% |
||||||
|
Other operating income/(expenses) |
53 |
1 |
-2 |
4 |
56 |
8.0% |
||||||
|
Normalized EBIT |
949 |
-21 |
-36 |
-31 |
861 |
-3.3% |
||||||
|
Normalized EBITDA |
1 273 |
-22 |
-47 |
-17 |
1 186 |
-1.4% |
||||||
|
Normalized EBITDA margin |
34.6% |
35.0% |
116bps |
|||||||||
|
|
||||||||||||
|
Global Export and Holding Companies |
HY23 |
Scope |
Currency Translation |
Organic Growth |
HY24 |
Organic Growth |
||||||
|
Total volumes (thousand hls) |
117 |
- |
- |
15 |
132 |
12.5% |
||||||
|
Revenue |
236 |
- |
1 |
-16 |
221 |
-6.9% |
||||||
|
Cost of sales |
-281 |
- |
- |
2 |
-279 |
0.7% |
||||||
|
Gross profit |
-45 |
- |
1 |
-14 |
-59 |
- |
||||||
|
SG&A |
-692 |
38 |
2 |
-129 |
-781 |
-19.7% |
||||||
|
Other operating income/(expenses) |
-6 |
- |
- |
-25 |
-31 |
- |
||||||
|
Normalized EBIT |
-742 |
38 |
2 |
-168 |
-870 |
-23.9% |
||||||
|
Normalized EBITDA |
-545 |
38 |
3 |
-86 |
-590 |
-16.9% |
||||||
Annex 3: Consolidated statement of financial position
|
Million US dollar |
|
|
||
|
ASSETS |
||||
|
Non-current assets |
||||
|
Property, plant and equipment |
25 086 |
26 818 |
||
|
|
113 451 |
117 043 |
||
|
Intangible assets |
40 703 |
41 286 |
||
|
Investments in associates |
4 865 |
4 872 |
||
|
Investment securities |
185 |
178 |
||
|
Deferred tax assets |
2 771 |
2 935 |
||
|
Pensions and similar obligations |
12 |
12 |
||
|
Income tax receivables |
749 |
844 |
||
|
Derivatives |
184 |
44 |
||
|
Trade and other receivables |
1 687 |
1 941 |
||
|
Total non-current assets |
189 694 |
195 973 |
||
|
|
||||
|
Current assets |
||||
|
Investment securities |
252 |
67 |
||
|
Inventories |
5 567 |
5 583 |
||
|
Income tax receivables |
611 |
822 |
||
|
Derivatives |
448 |
505 |
||
|
Trade and other receivables |
6 705 |
6 024 |
||
|
Cash and cash equivalents |
7 392 |
10 332 |
||
|
Assets classified as held for sale |
51 |
34 |
||
|
Total current assets |
21 026 |
23 367 |
||
|
|
||||
|
Total assets |
210 720 |
219 340 |
||
|
|
||||
|
EQUITY AND LIABILITIES |
||||
|
Equity |
||||
|
Issued capital |
1 736 |
1 736 |
||
|
Share premium |
17 620 |
17 620 |
||
|
Reserves |
15 617 |
20 276 |
||
|
Retained earnings |
43 543 |
42 215 |
||
|
Equity attributable to equity holders of |
78 517 |
81 848 |
||
|
|
||||
|
Non-controlling interests |
10 725 |
10 828 |
||
|
Total equity |
89 241 |
92 676 |
||
|
|
||||
|
Non-current liabilities |
||||
|
Interest-bearing loans and borrowings |
75 944 |
74 163 |
||
|
Pensions and similar obligations |
1 495 |
1 673 |
||
|
Deferred tax liabilities |
11 761 |
11 874 |
||
|
Income tax payables |
408 |
589 |
||
|
Derivatives |
55 |
151 |
||
|
Trade and other payables |
880 |
738 |
||
|
Provisions |
368 |
320 |
||
|
Total non-current liabilities |
90 912 |
89 508 |
||
|
|
||||
|
Current liabilities |
||||
|
Bank overdrafts |
17 |
17 |
||
|
Interest-bearing loans and borrowings |
2 240 |
3 987 |
||
|
Income tax payables |
1 144 |
1 583 |
||
|
Derivatives |
5 223 |
5 318 |
||
|
Trade and other payables |
21 708 |
25 981 |
||
|
Provisions |
235 |
269 |
||
|
Total current liabilities |
30 566 |
37 156 |
||
|
|
||||
|
Total equity and liabilities |
210 720 |
219 340 |
||
Annex 4: Consolidated statement of cash flows
|
For the six-month period ended 30 June |
||||
|
Million US dollar |
2024 |
2023 |
||
|
. |
||||
|
OPERATING ACTIVITIES |
||||
|
Profit of the period |
3 236 |
2 655 |
||
|
Depreciation, amortization and impairment |
2 741 |
2 595 |
||
|
Net finance cost/(income) |
2 887 |
3 223 |
||
|
Equity-settled share-based payment expense |
315 |
286 |
||
|
Income tax expense |
1 546 |
1 192 |
||
|
Other non-cash items |
339 |
321 |
||
|
Share of result of associates |
-241 |
-105 |
||
|
Cash flow from operating activities before changes in working capital and use of provisions |
10 824 |
10 167 |
||
|
Decrease/(increase) in trade and other receivables |
-1 154 |
-1 325 |
||
|
Decrease/(increase) in inventories |
-325 |
-228 |
||
|
Increase/(decrease) in trade and other payables |
-2 691 |
-3 062 |
||
|
Pension contributions and use of provisions |
-251 |
-192 |
||
|
Cash generated from operations |
6 403 |
5 360 |
||
|
Interest paid |
-2 001 |
-2 322 |
||
|
Interest received |
303 |
512 |
||
|
Dividends received |
123 |
43 |
||
|
Income tax paid |
-2 260 |
-1 996 |
||
|
Cash flow from/(used in) operating activities |
2 568 |
1 597 |
||
|
. |
||||
|
INVESTING ACTIVITIES |
||||
|
Acquisition of property, plant and equipment and of intangible assets |
-1 735 |
-2 107 |
||
|
Proceeds from sale of property, plant and equipment and of intangible assets |
52 |
44 |
||
|
Sale/(acquisition) of subsidiaries, net of cash disposed/ acquired of |
-19 |
-8 |
||
|
Proceeds from sale/(acquisition) of other assets |
-29 |
-18 |
||
|
Cash flow from/(used in) investing activities |
-1 732 |
-2 089 |
||
|
. |
||||
|
FINANCING ACTIVITIES |
||||
|
Proceeds from borrowings |
5 466 |
181 |
||
|
Repayments of borrowings |
-4 342 |
-26 |
||
|
Dividends paid |
-2 142 |
-1 923 |
||
|
Share buyback |
-838 |
- |
||
|
Payment of lease liabilities |
-406 |
-359 |
||
|
Derivative financial instruments |
-172 |
-360 |
||
|
Sale/(acquisition) of non-controlling interests |
-414 |
-3 |
||
|
Other financing cash flows |
-465 |
-305 |
||
|
Cash flow from/(used in) financing activities |
-3 313 |
-2 795 |
||
|
. |
||||
|
Net increase/(decrease) in cash and cash equivalents |
-2 476 |
-3 287 |
||
|
Cash and cash equivalents less bank overdrafts at beginning of year |
10 314 |
9 890 |
||
|
Effect of exchange rate fluctuations |
-463 |
191 |
||
|
Cash and cash equivalents less bank overdrafts at end of period |
7 375 |
6 794 |
View source version on businesswire.com: https://www.businesswire.com/news/home/20240731260058/en/
Investors
E-mail: shaun.fullalove@ab-inbev.com
E-mail: ekaterina.baillie@ab-inbev.com
E-mail: cyrus.nentin@ab-inbev.com
Media
Media Relations
E-mail: media.relations@ab-inbev.com
Source:
