Newmont Reports 2024 Mineral Reserves of 134.1 Million Gold Ounces and 13.5 Million Tonnes of Copper
This press release features multimedia. View the full release here: https://www.businesswire.com/news/home/20250220938621/en/
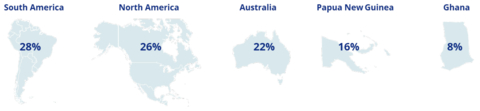
Percentage of Gold Reserves by Jurisdiction (Graphic: Business Wire)
"
2024 Reserves & Resources Highlights
- The gold industry's largest reserve base with 134.1 million attributable ounces, inclusive of the assets held for divestment (125.5 million attributable ounces for the go-forward Tier 1 portfolio); 2024 reserves include updates to gold price and cost escalation assumptions, additions, net revisions and depletion
-
Newmont's reserve base has approximately doubled since 2018 and is strategically diversified across the world's most favorable mining jurisdictions -
Newmont benefits from a strong operating asset base with gold reserve life of ten years or more at Boddington, Lihir, Cadia, Tanami, Ahafo, Merian,Cerro Negro ,Pueblo Viejo andNevada Gold Mines (NGM), further enhanced by a broader portfolio and organic project pipeline - Measured & Indicated Gold Mineral Resources2 of 99.4 million attributable ounces (90.5 million attributable ounces for the Tier 1 portfolio) and Inferred Resources of 70.6 million attributable ounces (64.9 million attributable ounces for the Tier 1 portfolio)
- Significant exposure to copper with 13.5 million attributable tonnes in reserves, 14.1 million attributable tonnes in Measured & Indicated resources and 11.0 million attributable tonnes in Inferred resources for the Tier 1 portfolio
- Additional exposure to other metals including silver, lead, zinc and molybdenum
Percentage of Gold Reserves by Jurisdiction3
Newmont’s reserve base is a key differentiator with an average reserve grade of 0.96 grams per tonne and an operating reserve life of more than ten years at seven managed sites and two non-managed joint ventures, with significant upside potential from a robust organic project pipeline. In addition,
PROVEN & PROBABLE GOLD RESERVES
For 2024,
ASSET-LEVEL SUMMARY
Managed Tier 1 Assets
- Boddington reserves increased by 13 percent to 10.8 million ounces, primarily driven by favorable price related revisions of 1.6 million ounces (net of cost escalation assumptions), as well as net positive revisions of 0.2 million ounces, partially offset by 0.6 million ounces from depletion
- Tanami reserves increased by 6 percent to 5.1 million ounces as a result of net favorable price and cost escalation related revisions of 0.2 million ounces and net positive revisions of 0.3 million ounces, partially offset by depletion of 0.4 million ounces
- Cadia reserves decreased slightly by 4 percent to 14.1 million ounces, primarily driven by depletion of 0.6 million ounces
- Ahafo South reserves decreased by 10 percent to 4.6 million ounces largely due to the depletion of 0.9 million ounces; price related revisions (net of cost escalation assumptions) resulted in an additional reduction of 0.2 million ounces, while 0.2 and 0.1 million ounces were added through exploration and favorable net revisions, respectively
- Lihir reserves decreased by 10 percent to 15.8 million ounces as favorable price related revisions of 1.8 million ounces (net of cost escalation assumptions) were offset by unfavorable net revisions of 2.9 million ounces, largely due to pit design updates and geotechnical changes, as well as depletion of 0.7 million ounces
- Peñasquito reserves decreased by 11 percent to 4.1 million ounces largely due to the depletion of 0.6 million ounces
Emerging Tier 1 Assets
- Merian reserves increased by 5 percent to 4.1 million ounces, primarily due to favorable price related revisions of 0.3 million ounces (net of cost escalation assumptions), as well as 0.2 million ounces added through exploration
-
Cerro Negro reserves remained largely unchanged at 3.2 million ounces - Yanacocha reserves decreased slightly by 4 percent to 5.3 million ounces largely due to the depletion of 0.4 million ounces, partially offset by favorable net revisions of 0.2 million ounces
- Red Chris reserves decreased by 5 percent to 3.7 million ounces due to net unfavorable revisions of 0.1 million ounces, as well as 0.1 million ounces from unfavorable price and cost escalation revisions and depletion
- Brucejack reserves decreased by 39 percent to 1.9 million ounces, primarily due to unfavorable net revisions of 1.5 million ounces due to updated resource model assumptions, including tighter drill hole spacing requirements and other technical considerations, partially offset by net favorable price and cost escalation related revisions of 0.3 million ounces and exploration additions of 0.3 million ounces
Non-Managed Tier 1 Assets
- Newmont’s 38.5 percent interest in NGM represented 17.9 million attributable ounces of gold reserves at year end, compared to 18.3 million ounces at the end of 2023
-
Newmont's 40 percent interest inPueblo Viejo represented 8.2 million attributable ounces of gold reserves at year end, compared to 8.0 million ounces at the end of 2023
Assets Held for Sale
Reserves at the assets held for sale increased by 14 percent to 8.7 million ounces, primarily driven by net favorable price and cost escalation related revisions of 2.0 million ounces, in addition to 0.9 million ounces added through exploration. These favorable increases were partially offset by the depletion of 1.3 million ounces and net unfavorable revisions of 0.4 million ounces.
GOLD RESOURCES5,6
At the end of 2024,
Total Mineral Resources at
Total Mineral Resources from assets held for sale increased by 0.5 million ounces, primarily driven by Musselwhite,
Newmont’s Measured and Indicated Gold Mineral Resource grade increased to 0.59 grams per tonne compared to 0.57 grams per tonne in the prior year. Inferred Gold Mineral Resource decreased to 0.55 grams per tonne compared to 0.57 grams per tonne in the prior year.
OTHER METALS
In 2024, copper reserves and resources were materially unchanged. Copper reserves decreased slightly to 13.5 million tonnes from 13.7 million tonnes in the prior year, primarily due to depletion. Measured and Indicated copper resources decreased to 14.1 million tonnes from 15.0 million tonnes. Inferred copper resources increased slightly to 11.0 million tonnes from 10.9 million tonnes.
Silver reserves decreased to 530 million ounces compared to 596 million ounces in the prior year, primarily due to depletion. Silver resources increased during the year due to the impact of the net positive revisions and the downstream effect of increased gold price. Measured and Indicated silver resources increased to 469 million ounces from 457 million ounces in the prior year. Inferred silver resources increased to 113 million ounces from 108 million ounces in the prior year.
Lead reserves decreased slightly to 0.8 million tonnes from 0.9 million tonnes primarily due to depletion. Measured and Indicated lead resources decreased to 0.5 million tonnes from 0.6 million tonnes, and Inferred lead resources remained unchanged at 0.1 million tonnes. Zinc reserves decreased to 1.7 million tonnes from 2.2 million tonnes primarily due to depletion and negative revisions at Peñasquito. Measured and Indicated zinc resources decreased to 1.2 million tonnes from 1.5 million tonnes, and Inferred zinc resources remained unchanged at 0.1 million tonnes.
Molybdenum reserves were largely unchanged at 0.2 million tonnes. Measured and Indicated molybdenum resources remained unchanged at 0.1 million tonnes, with Inferred molybdenum resources of 0.1 million tonnes.
EXPLORATION OUTLOOK
Newmont’s attributable exploration expenditure for managed operations is expected to be approximately
Additionally, Newmont’s share of exploration investment for its non-managed operations is expected to be approximately
Geographically,
UPDATED GOLD PRICE FOR MINERAL RESERVES AND MINERAL RESOURCES
As part of the annual Mineral Reserves and Mineral Resources update,
In line with market conditions,
GOLD RESERVE SENSITIVITY
A
KEY RESERVE AND RESOURCE ASSUMPTIONS7
|
|
At |
|
|
|
2024 |
2023 |
|
Gold Reserves ($/oz) |
|
|
|
Gold Resources ($/oz) |
|
|
|
Copper Reserves ($/lb) |
|
|
|
Copper Resources ($/lb) |
|
|
|
Silver Reserves ($/oz) |
|
|
|
Silver Resources ($/oz) |
|
|
|
Lead Reserves ($/lb) |
|
|
|
Lead Resources ($/lb) |
|
|
|
Zinc Reserves ($/lb) |
|
|
|
Zinc Resources ($/lb) |
|
|
|
Molybdenum Reserves ($/lb) |
|
|
|
Molybdenum Resources ($/lb) |
|
|
|
Tungsten Resources ($/lb) |
N/A |
|
|
Australian Dollar (A$:US$) |
|
|
|
Canadian Dollar (C$:US$) |
|
|
|
West Texas Intermediate ($/bbl) |
|
|
For additional details on Newmont’s reported gold, copper, silver, lead, zinc, molybdenum and tungsten Mineral Reserves and Mineral Resources, please refer to the tables at the end of this release.
_______________________________
| 1 |
See definition of the go-forward Tier 1 portfolio and cautionary statement at the end of this release. |
|
| 2 |
Exclusive of Mineral Reserves |
|
| 3 |
|
|
| 4 |
Gold Equivalent Ounces (GEOs) are calculated using 2024 Mineral Reserve pricing for Gold ( |
|
| 5 |
Total resources presented includes Measured and Indicated resources of 99.4 million attributable gold ounces and Inferred resources of 70.6 million attributable gold ounces. See cautionary statement at the end of this release. |
|
| 6 |
Net Conversion inclusive of ounces reclassified from reserves to resources. |
|
| 7 |
For 2024 and 2023, |
RESERVE AND RESOURCE TABLES
Proven and probable reserves are based on extensive drilling, sampling, mine modeling and metallurgical testing from which
The proven and probable reserve figures presented herein are estimates based on information available at the time of calculation. No assurance can be given that the indicated levels of recovery of gold, copper, silver, lead, zinc and molybdenum will be realized. Ounces of gold or silver or tonnes of copper, lead, zinc or molybdenum included in the proven and probable reserves are those contained prior to losses during metallurgical treatment. Reserve estimates may require revision based on actual production. Market fluctuations in the price of gold, copper, silver, lead, zinc and molybdenum, as well as increased production costs or reduced metallurgical recovery rates, could render certain proven and probable reserves containing higher cost reserves uneconomic to exploit and might result in a reduction of reserves.
The measured, indicated, and inferred resource figures presented herein are estimates based on information available at the time of calculation and are exclusive of reserves. A “mineral resource” is a concentration or occurrence of solid material of economic interest in or on the Earth’s crust in such form, grade, or quality and quantity that there are reasonable prospects for eventual economic extraction. The location, quantity, grade or quality, continuity and other geological characteristics of a mineral resource are known, estimated or interpreted from specific geological evidence and knowledge, including sampling. The reference point for mineral resources is in situ. Mineral resources are sub-divided, in order of increasing geological confidence, into inferred, indicated and measured categories. Ounces of gold and silver or tonnes of copper, zinc, lead, molybdenum and tungsten included in the measured, indicated and inferred resources are those contained prior to losses during metallurgical treatment. The terms "measured resource," "indicated resource," and "inferred resource" mean that part of a mineral resource for which quantity and grade or quality are estimated on the basis of geological evidence and sampling that is considered to be comprehensive, adequate, or limited, respectively. Market fluctuations in the price of gold, silver, copper, zinc, lead and molybdenum as well as increased production costs or reduced metallurgical recovery rates, could change future estimates of resources.
Please refer to the reserves and resources cautionary statement at the end of the release.
|
Gold Reserves (1) |
|||||||||||||||||||
|
|
|
||||||||||||||||||
|
|
|
|
|
Proven Reserves |
|
Probable Reserves |
|
Proven and Probable Reserves |
|
|
Proven and Probable Reserves |
||||||||
|
Deposits/Districts |
|
|
|
Tonnage (2) (000 tonnes) |
Grade (g/tonne) |
Ounces (3) (000) |
|
Tonnage (2) (000 tonnes) |
Grade (g/tonne) |
Ounces (3) (000) |
|
Tonnage (2) (000 tonnes) |
Grade (g/tonne) |
Ounces (3) (000) |
|
Metallurgical Recovery (3) |
Tonnage (2) (000 tonnes) |
Grade (g/tonne) |
Ounces (3) (000) |
|
Brucejack, |
|
100% |
|
— |
— |
— |
|
8,600 |
6.95 |
1,900 |
|
8,600 |
6.95 |
1,900 |
|
96% |
11,500 |
8.44 |
3,100 |
|
|
|
70% |
|
— |
— |
— |
|
14,700 |
0.39 |
100 |
|
14,700 |
0.39 |
100 |
|
52% |
30,200 |
0.37 |
300 |
|
Red Chris Underground (4) |
|
70% |
|
— |
— |
— |
|
171,700 |
0.64 |
3,500 |
|
171,700 |
0.64 |
3,500 |
|
70% |
171,700 |
0.64 |
3,500 |
|
Total Red Chris, |
|
70% |
|
— |
— |
— |
|
186,400 |
0.62 |
3,700 |
|
186,400 |
0.62 |
3,700 |
|
69% |
201,900 |
0.60 |
3,900 |
|
Peñasquito Open Pits |
|
100% |
|
93,900 |
0.58 |
1,700 |
|
130,800 |
0.48 |
2,000 |
|
224,700 |
0.52 |
3,800 |
|
62% |
264,500 |
0.53 |
4,500 |
|
Peñasquito Stockpiles (5) |
|
100% |
|
4,700 |
0.60 |
100 |
|
27,300 |
0.21 |
200 |
|
32,000 |
0.26 |
300 |
|
37% |
26,500 |
0.20 |
200 |
|
Total Peñasquito, |
|
100% |
|
98,600 |
0.58 |
1,800 |
|
158,100 |
0.44 |
2,200 |
|
256,600 |
0.49 |
4,100 |
|
60% |
291,000 |
0.50 |
4,600 |
|
Merian, Suriname |
|
75% |
|
23,400 |
1.26 |
900 |
|
87,300 |
1.14 |
3,200 |
|
110,700 |
1.16 |
4,100 |
|
93% |
104,000 |
1.16 |
3,900 |
|
|
|
100% |
|
2,200 |
11.84 |
800 |
|
7,100 |
10.50 |
2,400 |
|
9,300 |
10.82 |
3,200 |
|
94% |
9,200 |
10.97 |
3,200 |
|
|
|
100% |
|
17,700 |
0.90 |
500 |
|
96,300 |
0.78 |
2,500 |
|
114,100 |
0.80 |
2,900 |
|
55% |
128,600 |
0.76 |
3,200 |
|
Yanacocha Underground |
|
100% |
|
— |
— |
— |
|
12,300 |
6.06 |
2,400 |
|
12,300 |
6.06 |
2,400 |
|
97% |
12,300 |
6.06 |
2,400 |
|
Total Yanacocha, |
|
100% |
|
17,800 |
0.90 |
500 |
|
108,600 |
1.38 |
4,800 |
|
126,400 |
1.31 |
5,300 |
|
74% |
140,900 |
1.22 |
5,500 |
|
|
|
40% |
|
32,200 |
2.27 |
2,300 |
|
49,500 |
2.04 |
3,300 |
|
81,700 |
2.13 |
5,600 |
|
88% |
76,600 |
2.15 |
5,300 |
|
Pueblo Viejo Stockpiles (5) |
|
40% |
|
— |
— |
— |
|
38,800 |
2.07 |
2,600 |
|
38,800 |
2.07 |
2,600 |
|
83% |
39,700 |
2.12 |
2,700 |
|
Total |
|
40% |
|
32,200 |
2.27 |
2,300 |
|
88,300 |
2.06 |
5,800 |
|
120,500 |
2.11 |
8,200 |
|
86% |
116,300 |
2.14 |
8,000 |
|
NuevaUnión, |
|
50% |
|
— |
— |
— |
|
341,100 |
0.47 |
5,100 |
|
341,100 |
0.47 |
5,100 |
|
66% |
341,100 |
0.47 |
5,100 |
|
Norte Abierto, |
|
50% |
|
— |
— |
— |
|
598,800 |
0.60 |
11,600 |
|
598,800 |
0.60 |
11,600 |
|
74% |
598,800 |
0.60 |
11,600 |
|
|
|
100% |
|
276,500 |
0.64 |
5,600 |
|
219,200 |
0.61 |
4,300 |
|
495,700 |
0.62 |
9,900 |
|
84% |
407,900 |
0.66 |
8,600 |
|
Boddington Stockpiles (5) |
|
100% |
|
2,100 |
0.67 |
— |
|
61,900 |
0.42 |
800 |
|
64,100 |
0.43 |
900 |
|
83% |
72,000 |
0.44 |
1,000 |
|
Total Boddington, |
|
100% |
|
278,600 |
0.64 |
5,700 |
|
281,200 |
0.57 |
5,100 |
|
559,800 |
0.60 |
10,800 |
|
84% |
479,900 |
0.62 |
9,600 |
|
Tanami, |
|
100% |
|
10,100 |
5.25 |
1,700 |
|
19,800 |
5.28 |
3,400 |
|
29,900 |
5.27 |
5,100 |
|
98% |
26,600 |
5.66 |
4,800 |
|
Cadia, |
|
100% |
|
— |
— |
— |
|
1,051,800 |
0.42 |
14,100 |
|
1,051,800 |
0.42 |
14,100 |
|
81% |
1,102,300 |
0.42 |
14,700 |
|
Lihir Open Pits |
|
100% |
|
— |
— |
— |
|
125,900 |
2.86 |
11,600 |
|
125,900 |
2.86 |
11,600 |
|
77% |
159,900 |
2.76 |
14,200 |
|
Lihir Stockpiles (5) |
|
100% |
|
— |
— |
— |
|
77,100 |
1.68 |
4,200 |
|
77,100 |
1.68 |
4,200 |
|
77% |
57,200 |
1.83 |
3,400 |
|
Total Lihir, |
|
100% |
|
— |
— |
— |
|
203,000 |
2.41 |
15,800 |
|
203,000 |
2.41 |
15,800 |
|
77% |
217,100 |
2.51 |
17,500 |
|
Wafi-Golpu, |
|
50% |
|
— |
— |
— |
|
194,500 |
0.82 |
5,100 |
|
194,500 |
0.82 |
5,100 |
|
68% |
194,500 |
0.82 |
5,100 |
|
|
|
100% |
|
2,400 |
2.64 |
200 |
|
39,700 |
1.57 |
2,000 |
|
42,000 |
1.63 |
2,200 |
|
89% |
40,700 |
1.82 |
2,400 |
|
Ahafo South Underground |
|
100% |
|
6,100 |
2.97 |
600 |
|
15,200 |
2.36 |
1,200 |
|
21,300 |
2.54 |
1,700 |
|
94% |
22,600 |
2.64 |
1,900 |
|
Ahafo South Stockpiles (5) |
|
100% |
|
21,700 |
0.97 |
700 |
|
— |
— |
— |
|
21,700 |
0.97 |
700 |
|
91% |
23,400 |
1.01 |
800 |
|
Total Ahafo South, |
|
100% |
|
30,200 |
1.51 |
1,500 |
|
54,800 |
1.79 |
3,200 |
|
85,000 |
1.69 |
4,600 |
|
91% |
86,700 |
1.82 |
5,100 |
|
Ahafo North, |
|
100% |
|
— |
— |
— |
|
62,000 |
2.32 |
4,600 |
|
62,000 |
2.32 |
4,600 |
|
91% |
53,100 |
2.41 |
4,100 |
|
|
|
38.5% |
|
— |
— |
— |
|
124,200 |
1.16 |
4,600 |
|
124,200 |
1.16 |
4,600 |
|
77% |
154,700 |
1.01 |
5,000 |
|
NGM Stockpiles (5)(16) |
|
38.5% |
|
16,400 |
1.86 |
1,000 |
|
12,900 |
2.35 |
1,000 |
|
29,200 |
2.08 |
2,000 |
|
69% |
29,100 |
2.22 |
2,100 |
|
NGM Underground (17) |
|
38.5% |
|
4,000 |
11.28 |
1,400 |
|
39,700 |
7.73 |
9,900 |
|
43,700 |
8.06 |
11,300 |
|
89% |
40,200 |
8.62 |
11,100 |
|
Total NGM, |
|
38.5% |
|
20,400 |
3.69 |
2,400 |
|
176,800 |
2.72 |
15,500 |
|
197,100 |
2.82 |
17,900 |
|
84% |
224,100 |
2.54 |
18,300 |
|
Held for sale (20) |
|
|
|
|
|
|
|
|
|
|
|
|
|
|
|
|
|
|
|
|
|
|
100% |
|
87,000 |
0.43 |
1,200 |
|
28,600 |
0.43 |
400 |
|
115,600 |
0.43 |
1,600 |
|
58% |
46,600 |
0.40 |
600 |
|
CC&V Leach Pads (21) |
|
100% |
|
— |
— |
— |
|
34,600 |
0.73 |
800 |
|
34,600 |
0.73 |
800 |
|
55% |
28,300 |
0.74 |
700 |
|
Total CC&V, |
|
100% |
|
87,000 |
0.43 |
1,200 |
|
63,200 |
0.60 |
1,200 |
|
150,200 |
0.50 |
2,400 |
|
57% |
75,000 |
0.53 |
1,300 |
|
Musselwhite, |
|
100% |
|
4,100 |
6.69 |
900 |
|
3,200 |
6.10 |
600 |
|
7,400 |
6.43 |
1,500 |
|
96% |
7,000 |
6.52 |
1,500 |
|
Porcupine Underground |
|
100% |
|
1,600 |
5.09 |
300 |
|
2,700 |
7.27 |
600 |
|
4,400 |
6.45 |
900 |
|
89% |
3,000 |
7.75 |
700 |
|
|
|
100% |
|
300 |
2.09 |
— |
|
30,200 |
1.46 |
1,500 |
|
30,600 |
1.46 |
1,500 |
|
93% |
29,700 |
1.53 |
1,500 |
|
Total |
|
100% |
|
2,000 |
4.57 |
300 |
|
33,000 |
1.94 |
2,100 |
|
34,900 |
2.09 |
2,300 |
|
92% |
32,700 |
2.10 |
2,200 |
|
Éléonore, |
|
100% |
|
2,200 |
4.86 |
300 |
|
7,900 |
5.10 |
1,300 |
|
10,100 |
5.05 |
1,600 |
|
92% |
8,900 |
5.38 |
1,500 |
|
|
|
100% |
|
12,700 |
1.52 |
600 |
|
5,500 |
1.58 |
300 |
|
18,200 |
1.54 |
900 |
|
90% |
19,000 |
1.55 |
900 |
|
Akyem Stockpiles (5) |
|
100% |
|
700 |
0.72 |
— |
|
— |
— |
— |
|
700 |
0.72 |
— |
|
90% |
6,700 |
0.78 |
200 |
|
Total Akyem, |
|
100% |
|
13,500 |
1.48 |
600 |
|
5,500 |
1.58 |
300 |
|
19,000 |
1.50 |
900 |
|
90% |
25,600 |
1.35 |
1,100 |
|
Total Gold |
|
|
|
622,100 |
1.06 |
21,100 |
|
3,741,000 |
0.94 |
113,000 |
|
4,363,000 |
0.96 |
134,100 |
|
81% |
4,348,100 |
0.97 |
135,900 |
|
(1) |
At |
|
|
(2) |
Tonnages include allowances for losses resulting from mining methods. Tonnages are rounded to the nearest 100,000. |
|
|
(3) |
Ounces are estimates of metal contained in ore tonnages and do not include allowances for processing losses. Metallurgical recovery rates represent the estimated amount of metal to be recovered through metallurgical extraction processes. Ounces may not recalculate as they are rounded to the nearest 100,000. |
|
|
(4) |
Gold reserves at |
|
|
(5) |
Stockpiles are comprised primarily of material that has been set aside to allow processing of higher grade material in the mills. Stockpiles increase or decrease depending on current mine plans. Stockpile reserves are reported separately where ounces exceed 100,000 and are greater than 5% of the total site-reported reserves. |
|
|
(6) |
The net smelter return value utilized in 2024 reserves not less than |
|
|
(7) |
Gold reserves related to the undeveloped Yanacocha Sulfides project at |
|
|
(8) |
The |
|
|
(9) |
Project is currently undeveloped. Gold reserves at |
|
|
(10) |
Project is currently undeveloped. Gold reserves at |
|
|
(11) |
The net smelter return value utilized in 2024 reserves not less than |
|
|
(12) |
The net smelter return value utilized in 2024 reserves not less than |
|
|
(13) |
Cut-off grade utilized in 2024 reserves not less than 1.20 gram per tonne. |
|
|
(14) |
Gold reserves at |
|
|
(15) |
Cut-off grade utilized in 2024 reserves not less than 0.17 gram per tonne. |
|
|
(16) |
Cut-off grade utilized in 2024 reserves not less than 0.42 gram per tonne. |
|
|
(17) |
Cut-off grade utilized in 2024 reserves not less than 3.73 gram per tonne. |
|
|
(18) |
Gold reserves at |
|
|
(19) |
Currently included in the non-operating segment Corporate and Other in Note 4 to the Consolidated Financial Statements. |
|
|
(20) |
Sites are classified as held for sale as of |
|
|
(21) |
Leach pad material is the material on leach pads at the end of the year from which gold remains to be recovered. In-process reserves are reported separately where ounces exceed 100,000 and are greater than 5% of the total site-reported reserves. |
|
|
(22) |
Gold reserves at |
|
|
(23) |
Amounts presented herein have been rounded to the nearest 100,000 for ounces and tonnes and therefore may not agree to the respective Technical Report Summaries provided for certain properties as provided under exhibit 96. |
|
|
(24) |
Sites acquired through the |
|
Gold Resources at |
||||||||||||||||||||
|
|
|
|
|
Measured Resource |
|
Indicated Resource |
|
Measured and Indicated Resource |
|
Inferred Resource |
|
|
||||||||
|
Deposits/Districts |
|
Share |
|
Tonnage (000 tonnes) |
Grade (g/tonne) |
Ounces(3) (000) |
|
Tonnage (000 tonnes) |
Grade (g/tonne) |
Ounces(3) (000) |
|
Tonnage (000 tonnes) |
Grade (g/tonne) |
Ounces(3) (000) |
|
Tonnage (000 tonnes) |
Grade (g/tonne) |
Ounces(3) (000) |
|
Metallurgical Recovery (3) |
|
Brucejack, |
|
100% |
|
— |
— |
— |
|
4,300 |
4.68 |
600 |
|
4,300 |
4.68 |
600 |
|
16,600 |
5.8 |
3,100 |
|
96% |
|
Red Chris, |
|
70% |
|
— |
— |
— |
|
335,100 |
0.34 |
3,700 |
|
335,100 |
0.34 |
3,700 |
|
62,100 |
0.3 |
700 |
|
55% |
|
|
|
50% |
|
212,800 |
0.29 |
2,000 |
|
385,600 |
0.22 |
2,700 |
|
598,400 |
0.25 |
4,700 |
|
118,900 |
0.2 |
700 |
|
75% |
|
Peñasquito, |
|
100% |
|
48,200 |
0.30 |
500 |
|
163,100 |
0.22 |
1,100 |
|
211,300 |
0.24 |
1,600 |
|
21,100 |
0.2 |
100 |
|
57% |
|
|
|
50% |
|
— |
— |
— |
|
19,900 |
0.37 |
200 |
|
19,900 |
0.37 |
200 |
|
1,600 |
0.2 |
— |
|
50% |
|
Merian, Suriname |
|
75% |
|
5,800 |
1.03 |
200 |
|
58,600 |
1.08 |
2,000 |
|
64,500 |
1.08 |
2,200 |
|
70,000 |
0.9 |
2,000 |
|
90% |
|
|
|
100% |
|
1,300 |
3.77 |
200 |
|
1,900 |
5.65 |
300 |
|
3,200 |
4.88 |
500 |
|
7,600 |
4.8 |
1,200 |
|
94% |
|
Conga, |
|
100% |
|
— |
— |
— |
|
693,800 |
0.65 |
14,600 |
|
693,800 |
0.65 |
14,600 |
|
230,500 |
0.4 |
2,900 |
|
75% |
|
|
|
100% |
|
16,600 |
0.41 |
200 |
|
109,200 |
0.40 |
1,400 |
|
125,700 |
0.40 |
1,600 |
|
287,200 |
0.6 |
5,100 |
|
66% |
|
Yanacocha Underground |
|
100% |
|
500 |
4.07 |
100 |
|
6,200 |
4.70 |
900 |
|
6,700 |
4.65 |
1,000 |
|
3,400 |
5.0 |
500 |
|
97% |
|
Total Yanacocha, |
|
100% |
|
17,100 |
0.52 |
300 |
|
115,400 |
0.63 |
2,300 |
|
132,500 |
0.62 |
2,600 |
|
290,700 |
0.6 |
5,600 |
|
72% |
|
|
|
40% |
|
8,200 |
1.39 |
400 |
|
38,200 |
1.44 |
1,800 |
|
46,400 |
1.43 |
2,100 |
|
5,000 |
1.6 |
300 |
|
88% |
|
NuevaUnión, |
|
50% |
|
4,800 |
0.47 |
100 |
|
118,300 |
0.59 |
2,300 |
|
123,100 |
0.59 |
2,300 |
|
239,800 |
0.4 |
3,100 |
|
68% |
|
Norte Abierto, |
|
50% |
|
77,200 |
0.61 |
1,500 |
|
596,900 |
0.49 |
9,300 |
|
674,200 |
0.50 |
10,800 |
|
369,600 |
0.4 |
4,400 |
|
76% |
|
Boddington, |
|
100% |
|
90,600 |
0.55 |
1,600 |
|
154,100 |
0.53 |
2,600 |
|
244,700 |
0.54 |
4,200 |
|
3,500 |
0.6 |
100 |
|
84% |
|
|
|
100% |
|
9,700 |
1.65 |
500 |
|
26,500 |
1.45 |
1,200 |
|
36,200 |
1.50 |
1,700 |
|
5,300 |
1.1 |
200 |
|
90% |
|
Tanami Underground |
|
100% |
|
2,800 |
3.22 |
300 |
|
6,600 |
3.80 |
800 |
|
9,300 |
3.63 |
1,100 |
|
17,200 |
4.4 |
2,400 |
|
97% |
|
Total Tanami, |
|
100% |
|
12,500 |
1.99 |
800 |
|
33,000 |
1.92 |
2,000 |
|
45,500 |
1.94 |
2,800 |
|
22,500 |
3.6 |
2,600 |
|
94% |
|
Cadia Underground |
|
100% |
|
— |
— |
— |
|
1,245,100 |
0.36 |
14,200 |
|
1,245,100 |
0.36 |
14,200 |
|
549,400 |
0.3 |
4,800 |
|
81% |
|
Cadia Stockpiles and |
|
100% |
|
30,800 |
0.30 |
300 |
|
— |
— |
— |
|
30,800 |
0.30 |
300 |
|
11,000 |
0.7 |
200 |
|
65% |
|
Total Cadia, |
|
100% |
|
30,800 |
0.30 |
300 |
|
1,245,100 |
0.36 |
14,200 |
|
1,275,900 |
0.35 |
14,500 |
|
560,400 |
0.3 |
5,000 |
|
81% |
|
Namosi, |
|
73.24% |
|
— |
— |
— |
|
105,500 |
0.22 |
700 |
|
105,500 |
0.22 |
700 |
|
1,346,900 |
0.1 |
4,300 |
|
72% |
|
|
|
100% |
|
— |
— |
— |
|
43,600 |
1.97 |
2,800 |
|
43,600 |
1.97 |
2,800 |
|
227,400 |
2.4 |
17,600 |
|
75% |
|
Lihir Stockpiles |
|
100% |
|
— |
— |
— |
|
1,000 |
2.11 |
100 |
|
1,000 |
2.11 |
100 |
|
— |
— |
— |
|
75% |
|
Total Lihir, |
|
100% |
|
— |
— |
— |
|
44,600 |
1.97 |
2,800 |
|
44,600 |
1.97 |
2,800 |
|
227,400 |
2.4 |
17,600 |
|
75% |
|
|
|
50% |
|
— |
— |
— |
|
53,600 |
1.66 |
2,900 |
|
53,600 |
1.66 |
2,900 |
|
15,500 |
1.3 |
600 |
|
65% |
|
Wafi-Golpu Underground (13) |
|
50% |
|
— |
— |
— |
|
140,800 |
0.45 |
2,000 |
|
140,800 |
0.45 |
2,000 |
|
91,900 |
0.6 |
1,900 |
|
68% |
|
Total Wafi-Golpu, |
|
50% |
|
— |
— |
— |
|
194,500 |
0.78 |
4,900 |
|
194,500 |
0.78 |
4,900 |
|
107,300 |
0.7 |
2,600 |
|
67% |
|
|
|
100% |
|
3,900 |
1.13 |
100 |
|
6,500 |
0.83 |
200 |
|
10,400 |
0.95 |
300 |
|
3,500 |
1.2 |
100 |
|
85% |
|
Ahafo South Underground |
|
100% |
|
700 |
— |
100 |
|
27,100 |
3.96 |
3,400 |
|
27,800 |
3.95 |
3,500 |
|
11,500 |
3.1 |
1,200 |
|
91% |
|
Total Ahafo South, |
|
100% |
|
4,700 |
1.56 |
200 |
|
33,500 |
3.35 |
3,600 |
|
38,200 |
3.13 |
3,800 |
|
15,000 |
2.7 |
1,300 |
|
91% |
|
|
|
100.0% |
|
6,900 |
1.41 |
300 |
|
28,300 |
1.78 |
1,600 |
|
35,200 |
1.71 |
1,900 |
|
13,700 |
1.6 |
700 |
|
90% |
|
NGM Open Pits and Stockpiles |
|
38.5% |
|
3,700 |
1.23 |
100 |
|
158,500 |
0.74 |
3,800 |
|
162,200 |
0.76 |
4,000 |
|
56,700 |
0.9 |
1,600 |
|
72% |
|
NGM Underground |
|
38.5% |
|
200 |
23.55 |
200 |
|
21,500 |
6.34 |
4,400 |
|
21,800 |
6.52 |
4,600 |
|
25,100 |
6.4 |
5,200 |
|
87% |
|
Total NGM, Nevada (14)(16) |
|
38.5% |
|
3,900 |
2.51 |
300 |
|
180,000 |
1.41 |
8,200 |
|
183,900 |
1.44 |
8,500 |
|
81,800 |
2.6 |
6,700 |
|
82% |
|
Held for sale (17) |
|
|
|
|
|
|
|
|
|
|
|
|
|
|
|
|
|
|
|
|
|
CC&V, |
|
100% |
|
20,300 |
0.53 |
300 |
|
26,500 |
0.48 |
400 |
|
46,700 |
0.50 |
800 |
|
71,400 |
0.4 |
900 |
|
51% |
|
Musselwhite, |
|
100% |
|
1,500 |
4.21 |
200 |
|
2,300 |
4.10 |
300 |
|
3,800 |
4.15 |
500 |
|
1,900 |
5.0 |
300 |
|
96% |
|
Porcupine Underground |
|
100% |
|
— |
— |
— |
|
1,000 |
7.70 |
300 |
|
1,100 |
7.59 |
300 |
|
1,900 |
7.8 |
500 |
|
92% |
|
|
|
100% |
|
— |
— |
— |
|
75,600 |
1.51 |
3,700 |
|
75,600 |
1.51 |
3,700 |
|
65,900 |
1.4 |
2,900 |
|
92% |
|
Total |
|
100% |
|
— |
— |
— |
|
76,600 |
1.59 |
3,900 |
|
76,600 |
1.59 |
3,900 |
|
67,900 |
1.5 |
3,400 |
|
92% |
|
Éléonore, |
|
100% |
|
400 |
4.94 |
100 |
|
2,900 |
4.11 |
400 |
|
3,300 |
4.21 |
400 |
|
2,400 |
4.6 |
400 |
|
92% |
|
Coffee, |
|
100% |
|
900 |
2.14 |
100 |
|
49,300 |
1.26 |
2,000 |
|
50,200 |
1.28 |
2,100 |
|
6,700 |
1.0 |
200 |
|
81% |
|
Akyem, |
|
100% |
|
800 |
0.73 |
— |
|
9,700 |
3.83 |
1,200 |
|
10,600 |
3.58 |
1,200 |
|
5,500 |
3.0 |
500 |
|
92% |
|
Total Gold |
|
|
|
548,800 |
0.53 |
9,300 |
|
4,717,000 |
0.59 |
90,100 |
|
5,265,900 |
0.59 |
99,400 |
|
3,967,800 |
0.6 |
70,600 |
|
78% |
|
Gold Resources (1)(2) - |
||||||||||||||||||||
|
|
|
|
|
Measured Resource |
|
Indicated Resource |
|
Measured and Indicated Resource |
|
Inferred Resource |
|
|
||||||||
|
Deposits/Districts |
|
Share |
|
Tonnage (000 tonnes) |
Grade (g/tonne) |
Ounces(3) (000) |
|
Tonnage (000 tonnes) |
Grade (g/tonne) |
Ounces(3) (000) |
|
Tonnage (000 tonnes) |
Grade (g/tonne) |
Ounces(3) (000) |
|
Tonnage (000 tonnes) |
Grade (g/tonne) |
Ounces(3) (000) |
|
Metallurgical Recovery (3) |
|
CC&V, |
|
100% |
|
77,400 |
0.43 |
1,100 |
|
43,700 |
0.36 |
500 |
|
121,100 |
0.40 |
1,600 |
|
22,400 |
0.4 |
300 |
|
56% |
|
Musselwhite, |
|
100% |
|
900 |
4.36 |
100 |
|
1,300 |
4.17 |
200 |
|
2,200 |
4.25 |
300 |
|
1,200 |
5.0 |
200 |
|
96% |
|
Porcupine Underground |
|
100% |
|
200 |
4.55 |
— |
|
1,100 |
6.89 |
200 |
|
1,300 |
6.49 |
300 |
|
2,400 |
8.0 |
600 |
|
94% |
|
|
|
100% |
|
100 |
0.60 |
— |
|
66,300 |
1.65 |
3,500 |
|
66,300 |
1.65 |
3,500 |
|
59,800 |
1.5 |
2,800 |
|
92% |
|
Total |
|
100% |
|
300 |
3.67 |
— |
|
67,400 |
1.73 |
3,800 |
|
67,700 |
1.74 |
3,800 |
|
62,200 |
1.7 |
3,400 |
|
92% |
|
Éléonore, |
|
100% |
|
700 |
4.59 |
100 |
|
2,100 |
4.70 |
300 |
|
2,800 |
4.68 |
400 |
|
1,800 |
5.7 |
300 |
|
92% |
|
Brucejack, |
|
100% |
|
— |
— |
— |
|
1,800 |
7.64 |
500 |
|
1,800 |
7.64 |
500 |
|
12,100 |
10.3 |
4,000 |
|
96% |
|
Red Chris, |
|
70% |
|
— |
— |
— |
|
334,700 |
0.34 |
3,600 |
|
334,700 |
0.34 |
3,600 |
|
62,100 |
0.3 |
700 |
|
55% |
|
Coffee, |
|
100% |
|
900 |
2.14 |
100 |
|
49,300 |
1.27 |
2,000 |
|
50,200 |
1.28 |
2,100 |
|
6,700 |
1.0 |
200 |
|
81% |
|
|
|
50% |
|
212,800 |
0.29 |
2,000 |
|
385,600 |
0.22 |
2,700 |
|
598,400 |
0.25 |
4,700 |
|
118,900 |
0.2 |
700 |
|
75% |
|
Peñasquito, |
|
100% |
|
37,400 |
0.26 |
300 |
|
157,300 |
0.22 |
1,100 |
|
194,700 |
0.23 |
1,400 |
|
22,800 |
0.2 |
100 |
|
57% |
|
|
|
50% |
|
— |
— |
— |
|
19,900 |
0.37 |
200 |
|
19,900 |
0.37 |
200 |
|
1,600 |
0.2 |
— |
|
50% |
|
Merian, Suriname |
|
75% |
|
6,000 |
1.01 |
200 |
|
38,000 |
1.10 |
1,300 |
|
44,000 |
1.09 |
1,500 |
|
30,800 |
1.0 |
1,000 |
|
88% |
|
|
|
100% |
|
1,300 |
3.71 |
200 |
|
2,100 |
6.17 |
400 |
|
3,400 |
5.22 |
600 |
|
6,200 |
4.7 |
900 |
|
94% |
|
Conga, |
|
100% |
|
— |
— |
— |
|
693,800 |
0.65 |
14,600 |
|
693,800 |
0.65 |
14,600 |
|
230,500 |
0.4 |
2,900 |
|
75% |
|
|
|
100% |
|
16,800 |
0.41 |
200 |
|
111,300 |
0.43 |
1,500 |
|
128,000 |
0.42 |
1,700 |
|
186,500 |
0.8 |
4,800 |
|
67% |
|
Yanacocha Underground |
|
100% |
|
500 |
4.07 |
100 |
|
6,200 |
4.70 |
900 |
|
6,700 |
4.65 |
1,000 |
|
3,400 |
5.0 |
500 |
|
97% |
|
Total Yanacocha, |
|
100% |
|
17,300 |
0.52 |
300 |
|
117,500 |
0.65 |
2,500 |
|
134,800 |
0.64 |
2,800 |
|
189,900 |
0.9 |
5,400 |
|
73% |
|
|
|
40% |
|
7,300 |
1.47 |
300 |
|
37,300 |
1.49 |
1,800 |
|
44,600 |
1.49 |
2,100 |
|
3,200 |
1.6 |
200 |
|
82% |
|
NuevaUnión, |
|
50% |
|
4,800 |
0.47 |
100 |
|
118,300 |
0.59 |
2,300 |
|
123,100 |
0.59 |
2,300 |
|
239,800 |
0.4 |
3,100 |
|
68% |
|
Norte Abierto, |
|
50% |
|
77,200 |
0.61 |
1,500 |
|
596,900 |
0.49 |
9,300 |
|
674,200 |
0.50 |
10,800 |
|
369,600 |
0.4 |
4,400 |
|
76% |
|
Boddington, |
|
100% |
|
98,200 |
0.55 |
1,700 |
|
169,700 |
0.54 |
2,900 |
|
267,900 |
0.54 |
4,700 |
|
2,400 |
0.5 |
— |
|
83% |
|
|
|
100% |
|
9,400 |
1.67 |
500 |
|
23,800 |
1.47 |
1,100 |
|
33,200 |
1.53 |
1,600 |
|
4,200 |
1.1 |
200 |
|
90% |
|
Tanami Underground |
|
100% |
|
2,500 |
3.82 |
300 |
|
5,600 |
4.43 |
800 |
|
8,000 |
4.24 |
1,100 |
|
15,900 |
4.5 |
2,300 |
|
96% |
|
Total Tanami, |
|
100% |
|
11,900 |
2.12 |
800 |
|
29,400 |
2.03 |
1,900 |
|
41,200 |
2.06 |
2,700 |
|
20,100 |
3.8 |
2,400 |
|
94% |
|
Cadia Underground |
|
100% |
|
— |
— |
— |
|
1,596,600 |
0.32 |
16,200 |
|
1,596,600 |
0.32 |
16,200 |
|
497,000 |
0.2 |
3,800 |
|
80% |
|
Cadia Stockpiles and |
|
100% |
|
30,900 |
0.30 |
300 |
|
— |
— |
— |
|
30,900 |
0.30 |
300 |
|
11,000 |
0.7 |
200 |
|
65% |
|
Total Cadia, |
|
100% |
|
30,900 |
0.30 |
300 |
|
1,596,600 |
0.32 |
16,200 |
|
1,627,500 |
0.32 |
16,500 |
|
508,000 |
0.2 |
4,100 |
|
80% |
|
|
|
100% |
|
— |
— |
— |
|
25,900 |
0.56 |
500 |
|
25,900 |
0.56 |
500 |
|
— |
— |
— |
|
78% |
|
Telfer Underground |
|
100% |
|
— |
— |
— |
|
1,700 |
2.31 |
100 |
|
1,700 |
2.31 |
100 |
|
— |
— |
— |
|
90% |
|
Total Telfer, |
|
100% |
|
— |
— |
— |
|
27,600 |
0.67 |
600 |
|
27,600 |
0.67 |
600 |
|
— |
— |
— |
|
81% |
|
Havieron, |
|
70% |
|
— |
— |
— |
|
33,200 |
2.65 |
2,800 |
|
33,200 |
2.65 |
2,800 |
|
11,400 |
1.7 |
600 |
|
87% |
|
Namosi, |
|
73.24% |
|
— |
— |
— |
|
105,500 |
0.22 |
700 |
|
105,500 |
0.22 |
700 |
|
1,346,900 |
0.1 |
4,300 |
|
72% |
|
|
|
100% |
|
— |
— |
— |
|
25,000 |
2.03 |
1,600 |
|
25,000 |
2.03 |
1,600 |
|
227,400 |
2.4 |
17,500 |
|
80% |
|
Lihir Stockpiles |
|
100% |
|
— |
— |
— |
|
22,200 |
1.47 |
1,000 |
|
22,200 |
1.47 |
1,000 |
|
— |
— |
— |
|
78% |
|
Total Lihir, |
|
100% |
|
— |
— |
— |
|
47,100 |
1.77 |
2,700 |
|
47,100 |
1.77 |
2,700 |
|
227,400 |
2.4 |
17,500 |
|
79% |
|
|
|
50% |
|
— |
— |
— |
|
53,600 |
1.66 |
2,900 |
|
53,600 |
1.66 |
2,900 |
|
15,500 |
1.3 |
600 |
|
65% |
|
Wafi-Golpu Underground |
|
50% |
|
— |
— |
— |
|
140,800 |
0.45 |
2,000 |
|
140,800 |
0.45 |
2,000 |
|
91,900 |
0.6 |
1,900 |
|
68% |
|
Total Wafi-Golpu, |
|
50% |
|
— |
— |
— |
|
194,500 |
0.78 |
4,900 |
|
194,500 |
0.78 |
4,900 |
|
107,300 |
0.7 |
2,600 |
|
67% |
|
|
|
100% |
|
3,200 |
1.21 |
100 |
|
5,600 |
0.92 |
200 |
|
8,800 |
1.03 |
300 |
|
6,100 |
1.4 |
300 |
|
88% |
|
Ahafo South Underground |
|
100% |
|
— |
1.59 |
— |
|
27,200 |
3.71 |
3,200 |
|
27,200 |
3.71 |
3,200 |
|
13,800 |
3.0 |
1,300 |
|
91% |
|
Total Ahafo South, |
|
100% |
|
3,200 |
1.21 |
100 |
|
32,800 |
3.24 |
3,400 |
|
36,000 |
3.05 |
3,500 |
|
19,900 |
2.5 |
1,600 |
|
91% |
|
Ahafo North, |
|
100% |
|
5,000 |
1.46 |
200 |
|
12,700 |
1.88 |
800 |
|
17,700 |
1.76 |
1,000 |
|
6,600 |
1.6 |
300 |
|
91% |
|
Akyem, |
|
100% |
|
900 |
0.72 |
— |
|
9,800 |
3.83 |
1,200 |
|
10,600 |
3.57 |
1,200 |
|
5,600 |
2.9 |
500 |
|
92% |
|
|
|
38.5% |
|
4,000 |
0.99 |
100 |
|
175,200 |
0.99 |
5,500 |
|
179,200 |
0.99 |
5,700 |
|
101,000 |
0.8 |
2,500 |
|
75% |
|
NGM Underground |
|
38.5% |
|
1,400 |
7.51 |
300 |
|
20,900 |
5.95 |
4,000 |
|
22,200 |
6.04 |
4,300 |
|
23,100 |
6.5 |
4,800 |
|
84% |
|
Total NGM, |
|
38.5% |
|
5,300 |
2.66 |
500 |
|
196,000 |
1.52 |
9,600 |
|
201,400 |
1.55 |
10,000 |
|
124,100 |
1.8 |
7,300 |
|
80% |
|
Total Gold |
|
|
|
599,700 |
0.52 |
9,900 |
|
5,121,900 |
0.58 |
94,900 |
|
5,721,600 |
0.57 |
104,800 |
|
3,761,500 |
0.6 |
69,100 |
|
78% |
|
(1) |
Resources are reported exclusive of reserves. Amounts presented may not recalculate in total due to rounding. |
|
|
(2) |
At |
|
|
(3) |
Ounces are estimates of metal contained in ore tonnages and do not include allowances for processing losses. Metallurgical recovery rates represent the estimated amount of metal to be recovered through metallurgical extraction processes. Ounces may not recalculate as they are rounded to the nearest 100,000. |
|
|
(4) |
Gold resources related to the underground mine at |
|
|
(5) |
Project is currently undeveloped. Resource estimates provided by Teck Resources, the |
|
|
(6) |
Gold resources at |
|
|
(7) |
Gold resources related to the undeveloped Yanacocha Sulfides project at |
|
|
(8) |
The |
|
|
(9) |
Project is currently undeveloped. Gold resources at |
|
|
(10) |
Project is currently undeveloped. Gold resources at |
|
|
(11) |
Gold resources at |
|
|
(12) |
Gold resources at |
|
|
(13) |
Gold resources at |
|
|
(14) |
Gold resources at |
|
|
(15) |
Currently included in the non-operating segment Corporate and Other in Note 4 to the Consolidated Financial Statements. |
|
|
(16) |
Amounts presented herein have been rounded to the nearest 100,000 for ounces and tonnes and therefore may not agree to the respective Technical Report Summaries provided for certain properties as provided under exhibit 96. |
|
|
(17) |
Sites are classified as held for sale as of |
|
|
(18) |
Gold resources at |
|
|
(19) |
Sites acquired through the |
|
|
(20) |
In the fourth quarter of 2024, the Company completed the sale of the assets of the Telfer reportable segment, which includes the Havieron development project. Refer to Note 3 to the Consolidated Financial Statements for further information. |
|
Copper Reserves (1) |
||||||||||||||||||||
|
|
|
|
||||||||||||||||||
|
|
|
|
|
Proven Reserves |
|
Probable Reserves |
|
Proven and Probable Reserves |
|
|
|
Proven and Probable Reserves |
||||||||
|
Deposits/Districts |
|
|
|
Tonnage (2) (000 tonnes) |
Grade (Cu %) |
Tonnes (3) (000) |
|
Tonnage (2) (000 tonnes) |
Grade (Cu %) |
Tonnes (3) (000) |
|
Tonnage (2) (000 tonnes) |
Grade (Cu %) |
Tonnes (3) (000) |
|
Metallurgical Recovery (3) |
|
Tonnage (2) (000 tonnes) |
Grade (Cu %) |
Tonnes (3) (000) |
|
|
|
70% |
|
— |
—% |
— |
|
14,700 |
0.45% |
— |
|
14,700 |
0.45% |
— |
|
80% |
|
30,200 |
0.43% |
100 |
|
Red Chris Underground (4) |
|
70% |
|
— |
—% |
— |
|
171,700 |
0.52% |
900 |
|
171,700 |
0.52% |
900 |
|
84% |
|
171,700 |
0.52% |
900 |
|
Total Red Chris, |
|
70% |
|
— |
—% |
— |
|
186,400 |
0.52% |
1,000 |
|
186,400 |
0.52% |
1,000 |
|
84% |
|
201,900 |
0.51% |
1,000 |
|
Yanacocha, |
|
100% |
|
— |
—% |
— |
|
111,100 |
0.63% |
700 |
|
111,100 |
0.63% |
700 |
|
83% |
|
111,100 |
0.63% |
700 |
|
NuevaUnión, |
|
50% |
|
— |
—% |
— |
|
1,118,000 |
0.40% |
4,400 |
|
1,118,000 |
0.40% |
4,400 |
|
88% |
|
1,118,000 |
0.40% |
4,400 |
|
Norte Abierto, |
|
50% |
|
— |
—% |
— |
|
598,800 |
0.22% |
1,300 |
|
598,800 |
0.22% |
1,300 |
|
87% |
|
598,800 |
0.22% |
1,300 |
|
|
|
100% |
|
276,500 |
0.09% |
200 |
|
219,200 |
0.10% |
200 |
|
495,700 |
0.09% |
500 |
|
81% |
|
407,900 |
0.10% |
400 |
|
Boddington Stockpiles (8) |
|
100% |
|
2,100 |
0.13% |
— |
|
61,900 |
0.09% |
100 |
|
64,100 |
0.09% |
100 |
|
79% |
|
72,000 |
0.09% |
100 |
|
Total Boddington, |
|
100% |
|
278,600 |
0.09% |
200 |
|
281,200 |
0.10% |
300 |
|
559,800 |
0.09% |
500 |
|
81% |
|
479,900 |
0.10% |
500 |
|
Cadia, |
|
100% |
|
— |
—% |
— |
|
1,051,800 |
0.29% |
3,100 |
|
1,051,800 |
0.29% |
3,100 |
|
87% |
|
1,102,300 |
0.29% |
3,200 |
|
Wafi-Golpu, |
|
50% |
|
— |
—% |
— |
|
194,500 |
1.20% |
2,300 |
|
194,500 |
1.20% |
2,300 |
|
95% |
|
194,500 |
1.20% |
2,300 |
|
NGM, |
|
38.5% |
|
4,300 |
0.16% |
— |
|
71,000 |
0.18% |
100 |
|
75,400 |
0.18% |
100 |
|
66% |
|
86,100 |
0.17% |
100 |
|
Total Copper |
|
|
|
282,900 |
0.09% |
200 |
|
3,612,900 |
0.37% |
13,200 |
|
3,895,800 |
0.35% |
13,500 |
|
88% |
|
3,892,500 |
0.35% |
13,700 |
|
(1) |
At |
|
|
(2) |
Tonnages include allowances for losses resulting from mining methods. Tonnages are rounded to nearest 100,000. |
|
|
(3) |
Tonnes are estimates of metal contained in ore tonnages and do not include allowances for processing losses. Metallurgical recovery rates represent the estimated amount of metal to be recovered through metallurgical extraction processes. Tonnes may not recalculate as they are rounded to the nearest 100,000. |
|
|
(4) |
Copper reserves at |
|
|
(5) |
Copper reserve estimates relate to the undeveloped Yanacocha Sulfides project and at |
|
|
(6) |
Project is currently undeveloped. Copper reserves at |
|
|
(7) |
Project is currently undeveloped. Copper reserves at |
|
|
(8) |
Stockpiles are comprised primarily of material that has been set aside to allow processing of higher grade material in the mills. Stockpiles increase or decrease depending on current mine plans. Stockpiles are reported separately where pounds exceed 100 million and are greater than 5% of the total site reported reserves. |
|
|
(9) |
The net smelter return value utilized in 2024 reserves not less than |
|
|
(10) |
The net smelter return value utilized in 2024 reserves not less than |
|
|
(11) |
Copper reserves at |
|
|
(12) |
Copper cut-off grade varies with gold and silver credits. Copper reserves at |
|
|
(13) |
Currently included in the non-operating segment Corporate and Other in Note 4 to the Consolidated Financial Statements. |
|
|
(14) |
Amounts presented herein have been rounded to the nearest 100,000 for tonnes and therefore may not agree to the respective Technical Report Summaries provided for certain properties as provided under exhibit 96. |
|
|
(15) |
Sites acquired through the |
|
Copper Resources (1)(2) - |
|||||||||||||||||
|
|
|
|
|
Measured Resource |
Indicated Resource |
Measured and Indicated Resource |
Inferred Resource |
|
|
||||||||
|
Deposits/Districts |
|
Share |
|
Tonnage (000 tonnes) |
Grade (Cu%) |
Tonnes (3) (000) |
Tonnage (000 tonnes) |
Grade (Cu%) |
Tonnes (3) (000) |
Tonnage (000 tonnes) |
Grade (Cu%) |
Tonnes (3) (000) |
Tonnage (000 tonnes) |
Grade (Cu%) |
Tonnes (3) (000) |
|
Metallurgical Recovery (3) |
|
Red Chris, |
|
70% |
|
— |
—% |
— |
335,100 |
0.34% |
1,100 |
335,100 |
0.34% |
1,100 |
62,100 |
0.4% |
200 |
|
81% |
|
|
|
50% |
|
212,800 |
0.44% |
900 |
385,600 |
0.47% |
1,800 |
598,400 |
0.46% |
2,800 |
118,900 |
0.3% |
300 |
|
93% |
|
Conga, |
|
100% |
|
— |
—% |
— |
693,800 |
0.26% |
1,800 |
693,800 |
0.26% |
1,800 |
230,500 |
0.2% |
400 |
|
84% |
|
Yanacocha, |
|
100% |
|
1,500 |
1.02% |
— |
99,800 |
0.36% |
400 |
101,300 |
0.37% |
400 |
39,700 |
0.4% |
100 |
|
81% |
|
NuevaUnión, |
|
50% |
|
164,300 |
0.19% |
300 |
349,900 |
0.34% |
1,200 |
514,100 |
0.30% |
1,500 |
602,200 |
0.4% |
2,300 |
|
89% |
|
Norte Abierto, |
|
50% |
|
57,600 |
0.24% |
100 |
551,300 |
0.19% |
1,100 |
608,900 |
0.20% |
1,200 |
361,800 |
0.2% |
700 |
|
90% |
|
Boddington, |
|
100% |
|
90,600 |
0.12% |
100 |
154,100 |
0.11% |
200 |
244,700 |
0.12% |
300 |
3,500 |
0.1% |
— |
|
83% |
|
|
|
100% |
|
30,800 |
0.13% |
— |
— |
—% |
3,200 |
30,800 |
0.13% |
3,200 |
11,000 |
0.5% |
900 |
|
85% |
|
Cadia Underground |
|
100% |
|
— |
—% |
— |
1,245,100 |
0.25% |
— |
1,245,100 |
0.25% |
— |
549,400 |
0.2% |
100 |
|
86% |
|
Total Cadia, |
|
100% |
|
30,800 |
0.13% |
— |
1,245,100 |
0.25% |
3,200 |
1,275,900 |
0.25% |
3,200 |
560,400 |
0.2% |
1,000 |
|
86% |
|
|
|
73.24% |
|
— |
—% |
— |
105,500 |
0.61% |
600 |
105,500 |
0.61% |
600 |
1,346,900 |
0.3% |
4,300 |
|
84% |
|
Namosi Underground |
|
73.24% |
|
— |
—% |
— |
— |
—% |
— |
— |
—% |
— |
209,900 |
0.4% |
900 |
|
92% |
|
Total Namosi, |
|
73.24% |
|
— |
—% |
— |
105,500 |
0.61% |
600 |
105,500 |
0.61% |
600 |
1,556,800 |
0.3% |
5,200 |
|
85% |
|
Wafi-Golpu, |
|
50% |
|
— |
—% |
— |
140,800 |
0.73% |
1,000 |
140,800 |
0.73% |
1,000 |
91,900 |
0.7% |
600 |
|
95% |
|
NGM, |
|
38.5% |
|
— |
—% |
— |
113,700 |
0.17% |
200 |
113,700 |
0.17% |
200 |
11,100 |
0.2% |
— |
|
67% |
|
Total Copper |
|
|
|
557,600 |
0.28% |
1,600 |
4,174,600 |
0.30% |
12,600 |
4,732,200 |
0.30% |
14,100 |
3,638,800 |
0.3% |
11,000 |
|
87% |
|
Copper Resources at |
|||||||||||||||||||
|
|
|
|
Measured Resources |
|
Indicated Resources |
|
Measured and Indicated Resources |
|
Inferred Resources |
|
|
||||||||
|
Deposits/Districts |
Share |
|
Tonnage (000 tonnes) |
Grade (Cu%) |
Tonnes (3) (000) |
|
Tonnage (000 tonnes) |
Grade (Cu%) |
Tonnes (3) (000) |
|
Tonnage (000 tonnes) |
Grade (Cu%) |
Tonnes (3) (000) |
|
Tonnage (000 tonnes) |
Grade (Cu%) |
Tonnes (3) (000) |
|
Metallurgical Recovery (3) |
|
Red Chris, |
70% |
|
— |
—% |
— |
|
334,700 |
0.34% |
1,100 |
|
334,700 |
0.34% |
1,100 |
|
62,100 |
0.4% |
200 |
|
81% |
|
|
50% |
|
212,800 |
0.44% |
900 |
|
385,600 |
0.47% |
1,800 |
|
598,400 |
0.46% |
2,800 |
|
118,900 |
0.3% |
300 |
|
93% |
|
Conga, |
100% |
|
— |
—% |
— |
|
693,800 |
0.26% |
1,800 |
|
693,800 |
0.26% |
1,800 |
|
230,500 |
0.2% |
400 |
|
84% |
|
Yanacocha, |
100% |
|
1,500 |
1.02% |
— |
|
99,800 |
0.36% |
400 |
|
101,300 |
0.37% |
400 |
|
39,700 |
0.4% |
100 |
|
81% |
|
NuevaUnión, |
50% |
|
164,300 |
0.19% |
300 |
|
349,900 |
0.34% |
1,200 |
|
514,100 |
0.30% |
1,500 |
|
602,200 |
0.4% |
2,300 |
|
89% |
|
Norte Abierto, |
50% |
|
57,600 |
0.24% |
100 |
|
551,300 |
0.19% |
1,100 |
|
608,900 |
0.20% |
1,200 |
|
361,800 |
0.2% |
700 |
|
90% |
|
Boddington, |
100% |
|
98,200 |
0.11% |
100 |
|
169,700 |
0.11% |
200 |
|
267,900 |
0.11% |
300 |
|
2,400 |
0.1% |
— |
|
82% |
|
Cadia Underground |
100% |
|
— |
—% |
— |
|
1,596,600 |
0.23% |
3,700 |
|
1,596,600 |
0.23% |
3,700 |
|
497,000 |
0.2% |
900 |
|
85% |
|
|
100% |
|
30,900 |
0.13% |
— |
|
— |
—% |
— |
|
30,900 |
0.13% |
— |
|
11,000 |
0.5% |
100 |
|
80% |
|
Total Cadia, |
100% |
|
30,900 |
0.13% |
— |
|
1,596,600 |
0.23% |
3,700 |
|
1,627,500 |
0.23% |
3,800 |
|
508,000 |
0.2% |
900 |
|
85% |
|
|
100% |
|
— |
—% |
— |
|
20,300 |
0.06% |
— |
|
20,300 |
0.06% |
— |
|
— |
—% |
— |
|
49% |
|
Telfer Stockpiles |
100% |
|
— |
—% |
— |
|
5,600 |
0.07% |
— |
|
5,600 |
0.07% |
— |
|
— |
—% |
— |
|
46% |
|
Telfer Underground |
100% |
|
— |
—% |
— |
|
1,700 |
0.56% |
— |
|
1,700 |
0.56% |
— |
|
— |
—% |
— |
|
94% |
|
Total Telfer, |
100% |
|
— |
—% |
— |
|
27,600 |
0.09% |
— |
|
27,600 |
0.09% |
— |
|
— |
—% |
— |
|
65% |
|
Havieron, |
70% |
|
— |
—% |
— |
|
33,200 |
0.34% |
100 |
|
33,200 |
0.34% |
100 |
|
11,400 |
0.2% |
— |
|
86% |
|
Telfer Projects, |
100% |
|
— |
—% |
— |
|
51,700 |
0.29% |
100 |
|
51,700 |
0.29% |
100 |
|
1,900 |
0.3% |
— |
|
78% |
|
|
73.24% |
|
— |
—% |
— |
|
105,500 |
0.61% |
600 |
|
105,500 |
0.61% |
600 |
|
1,346,900 |
0.3% |
4,300 |
|
84% |
|
Namosi Underground |
73.24% |
|
— |
—% |
— |
|
— |
—% |
— |
|
— |
—% |
— |
|
209,900 |
0.4% |
900 |
|
92% |
|
Total Namosi, |
73.24% |
|
— |
—% |
— |
|
105,500 |
0.61% |
600 |
|
105,500 |
0.61% |
600 |
|
1,556,800 |
0.3% |
5,200 |
|
85% |
|
Wafi-Golpu, |
50% |
|
— |
—% |
— |
|
140,800 |
0.73% |
1,000 |
|
140,800 |
0.73% |
1,000 |
|
91,900 |
0.7% |
600 |
|
95% |
|
NGM, |
38.5% |
|
— |
—% |
— |
|
136,000 |
0.15% |
200 |
|
136,000 |
0.15% |
200 |
|
19,300 |
0.2% |
— |
|
65% |
|
Total Copper |
|
|
565,300 |
0.28% |
1,600 |
|
4,676,100 |
0.29% |
13,500 |
|
5,241,400 |
0.29% |
15,000 |
|
3,606,800 |
0.3% |
10,900 |
|
88% |
|
(1) |
Resources are reported exclusive of reserves. Amounts presented may not recalculate in total due to rounding. |
|
|
(2) |
At |
|
|
(3) |
Tonnes are estimates of metal contained in ore tonnages and do not include allowances for processing losses. Metallurgical recovery rates represent the estimated amount of metal to be recovered through metallurgical extraction processes. Tonnes may not recalculate as they are rounded to the nearest 100,000. |
|
|
(4) |
Copper resources related to the underground mine at |
|
|
(5) |
Project is currently undeveloped. Resource estimates provided by Teck Resources. |
|
|
(6) |
Copper resources at |
|
|
(7) |
Copper resources related to the undeveloped Yanacocha Sulfides project at |
|
|
(8) |
Project is currently undeveloped. Copper resources at |
|
|
(9) |
Project is currently undeveloped. Copper resources at |
|
|
(10) |
Copper resources related to the open pit mine at |
|
|
(11) |
Copper resources at |
|
|
(12) |
Currently included in the non-operating segment Corporate and Other in Note 4 to the Consolidated Financial Statements. |
|
|
(13) |
Amounts presented herein have been rounded to the nearest 100,000 for tonnes and therefore may not agree to the respective Technical Report Summaries provided for certain properties as provided under exhibit 96. |
|
|
(14) |
Sites acquired through the |
|
|
(15) |
In the fourth quarter of 2024, the Company completed the sale of the assets of the Telfer reportable segment, which includes the Havieron development project. Refer to Note 3 to the Consolidated Financial Statements for further information. |
|
Silver Reserves (1) |
||||||||||||||||||||
|
|
|
|
||||||||||||||||||
|
|
|
|
|
Proven Reserves |
|
Probable Reserves |
|
Proven and Probable Reserves |
|
|
|
Proven and Probable Reserves |
||||||||
|
Deposits/Districts |
|
|
|
Tonnage (2) (000 tonnes) |
Grade (g/tonne) |
Ounces (3) (000) |
|
Tonnage (2) (000 tonnes) |
Grade (g/tonne) |
Ounces (3) (000) |
|
Tonnage (2) (000 tonnes) |
Grade (g/tonne) |
Ounces (3) (000) |
|
Metallurgical Recovery (3) |
|
Tonnage (2) (000 tonnes) |
Grade (g/tonne) |
Ounces (3) (000) |
|
Brucejack, |
|
100% |
|
— |
— |
— |
|
8,600 |
34.36 |
9,500 |
|
8,600 |
34.36 |
9,500 |
|
83% |
|
11,500 |
34.71 |
12,800 |
|
Peñasquito Open Pits |
|
100% |
|
93,900 |
34.68 |
104,700 |
|
130,800 |
28.52 |
119,900 |
|
224,700 |
31.09 |
224,600 |
|
83% |
|
264,500 |
33.84 |
287,800 |
|
Peñasquito Stockpiles (4) |
|
100% |
|
4,700 |
25.38 |
3,800 |
|
27,300 |
28.32 |
24,800 |
|
32,000 |
27.89 |
28,700 |
|
73% |
|
26,500 |
29.18 |
24,900 |
|
Total Peñasquito, |
|
100% |
|
98,600 |
34.24 |
108,500 |
|
158,100 |
28.49 |
144,800 |
|
256,600 |
30.70 |
253,300 |
|
82% |
|
291,000 |
33.42 |
312,600 |
|
|
|
100% |
|
2,200 |
89.85 |
6,400 |
|
7,100 |
65.87 |
15,000 |
|
9,300 |
71.58 |
21,400 |
|
75% |
|
9,200 |
72.58 |
21,500 |
|
Yanacocha Open Pits and Underground |
|
100% |
|
— |
— |
— |
|
93,400 |
19.89 |
59,800 |
|
93,400 |
19.89 |
59,800 |
|
54% |
|
93,400 |
19.89 |
59,800 |
|
Yanacocha Stockpiles and Leach Pads (4)(6) |
|
100% |
|
— |
— |
— |
|
78,900 |
9.33 |
23,600 |
|
78,900 |
9.33 |
23,600 |
|
13% |
|
86,000 |
9.07 |
25,100 |
|
Total Yanacocha, |
|
100% |
|
— |
— |
— |
|
172,300 |
15.05 |
83,400 |
|
172,300 |
15.05 |
83,400 |
|
43% |
|
179,500 |
14.70 |
84,800 |
|
Pueblo Viejo Open Pits |
|
40% |
|
32,200 |
12.44 |
12,900 |
|
49,500 |
11.49 |
18,300 |
|
81,700 |
11.86 |
31,200 |
|
71% |
|
76,600 |
12.59 |
31,000 |
|
Pueblo Viejo Stockpiles (4) |
|
40% |
|
— |
— |
— |
|
38,800 |
14.22 |
17,700 |
|
38,800 |
14.22 |
17,700 |
|
71% |
|
39,700 |
14.48 |
18,500 |
|
Total |
|
40% |
|
32,200 |
12.44 |
12,900 |
|
88,300 |
12.69 |
36,000 |
|
120,500 |
12.62 |
48,900 |
|
71% |
|
116,300 |
13.24 |
49,500 |
|
NuevaUnión, |
|
50% |
|
— |
— |
— |
|
1,118,000 |
1.31 |
47,200 |
|
1,118,000 |
1.31 |
47,200 |
|
66% |
|
1,118,000 |
1.31 |
47,200 |
|
Norte Abierto, |
|
50% |
|
— |
— |
— |
|
598,800 |
1.52 |
29,300 |
|
598,800 |
1.52 |
29,300 |
|
74% |
|
598,800 |
1.52 |
29,300 |
|
Cadia, |
|
100% |
|
— |
— |
— |
|
1,051,800 |
0.67 |
22,800 |
|
1,051,800 |
0.67 |
22,800 |
|
68% |
|
1,102,300 |
0.68 |
24,000 |
|
|
|
38.5% |
|
— |
— |
— |
|
54,600 |
7.78 |
13,700 |
|
54,600 |
7.78 |
13,700 |
|
38% |
|
60,800 |
6.93 |
13,600 |
|
NGM Stockpiles (4) |
|
38.5% |
|
3,200 |
7.87 |
800 |
|
— |
— |
— |
|
3,200 |
7.87 |
800 |
|
38% |
|
2,400 |
7.97 |
600 |
|
Total NGM, |
|
38.5% |
|
3,200 |
7.87 |
800 |
|
54,600 |
7.78 |
13,700 |
|
57,900 |
7.78 |
14,500 |
|
38% |
|
63,200 |
6.97 |
14,200 |
|
Total Silver |
|
|
|
136,200 |
29.37 |
128,600 |
|
3,257,700 |
3.83 |
401,600 |
|
3,393,800 |
4.86 |
530,200 |
|
71% |
|
3,489,800 |
5.31 |
596,000 |
|
(1) |
At |
|
|
(2) |
Tonnages include allowances for losses resulting from mining methods. Tonnages are rounded to nearest 100,000. |
|
|
(3) |
Ounces are estimates of metal contained in ore tonnages and do not include allowances for processing losses. Metallurgical recovery rates represent the estimated amount of metal to be recovered through metallurgical extraction processes. Ounces may not recalculate as they are rounded to the nearest 100,000. |
|
|
(4) |
Stockpiles are comprised primarily of material that has been set aside to allow processing of higher grade material in the mills. Stockpiles increase or decrease depending on current mine plans. Stockpile reserves are reported separately where ounces exceed 100,000 and are greater than 5% of the total site-reported reserves. |
|
|
(5) |
The net smelter return value utilized in 2024 reserves not less than |
|
|
(6) |
Leach pad material is the material on leach pads at the end of the year from which silver remains to be recovered. In-process reserves are reported separately where ounces exceed 100,000 and are greater than 5% of the total site-reported reserves. |
|
|
(7) |
Silver reserves related to the undeveloped Yanacocha Sulfides project at |
|
|
(8) |
The |
|
|
(9) |
Project is currently undeveloped. Silver reserves at |
|
|
(10) |
Project is currently undeveloped. Silver reserves at |
|
|
(11) |
The net smelter return value utilized in 2024 reserves not less than |
|
|
(12) |
Silver cut-off grade varies with gold and copper credits. Silver reserves at |
|
|
(13) |
Currently included in the non-operating segment Corporate and Other in Note 4 to the Consolidated Financial Statements. |
|
|
(14) |
Amounts presented herein have been rounded to the nearest 100,000 for ounces and tonnes and therefore may not agree to the respective Technical Report Summaries provided for certain properties as provided under exhibit 96. |
|
|
(15) |
Sites acquired through the |
|
Silver Resources (1)(2) - |
||||||||||||||||||||
|
|
|
|
|
Measured Resource |
|
Indicated Resource |
|
Measured and Indicated Resource |
|
Inferred Resource |
|
|
||||||||
|
Deposits/Districts |
|
Share |
|
Tonnage (000 tonnes) |
Grade (g/tonne) |
Ounces (3) (000) |
|
Tonnage (000 tonnes) |
Grade (g/tonne) |
Ounces (3) (000) |
|
Tonnage (000 tonnes) |
Grade (g/tonne) |
Ounces (3) (000) |
|
Tonnage (000 tonnes) |
Grade (g/tonne) |
Ounces (3) (000) |
|
Metallurgical Recovery (3) |
|
Brucejack, |
|
100% |
|
— |
— |
— |
|
4,300 |
19.68 |
2,700 |
|
4,300 |
19.68 |
2,700 |
|
16,600 |
11.6 |
6,200 |
|
82% |
|
|
|
50% |
|
212,800 |
4.08 |
27,900 |
|
385,600 |
4.77 |
59,100 |
|
598,400 |
4.52 |
87,000 |
|
118,900 |
2.6 |
9,900 |
|
73% |
|
Peñasquito, |
|
100% |
|
48,200 |
27.22 |
42,200 |
|
163,100 |
24.84 |
130,300 |
|
211,300 |
25.39 |
172,400 |
|
21,100 |
25.4 |
17,200 |
|
80% |
|
|
|
50% |
|
— |
— |
— |
|
19,900 |
13.99 |
9,000 |
|
19,900 |
13.99 |
9,000 |
|
1,600 |
11.0 |
500 |
|
25% |
|
Cerro Negro Underground |
|
100% |
|
100 |
70.12 |
300 |
|
700 |
61.42 |
1,400 |
|
900 |
62.67 |
1,700 |
|
7,300 |
26.5 |
6,200 |
|
76% |
|
|
|
100% |
|
1,200 |
6.76 |
300 |
|
1,200 |
6.62 |
300 |
|
2,400 |
6.70 |
500 |
|
300 |
6.7 |
100 |
|
71% |
|
Total |
|
100% |
|
1,300 |
12.61 |
500 |
|
1,900 |
27.54 |
1,700 |
|
3,200 |
21.43 |
2,200 |
|
7,600 |
25.7 |
6,300 |
|
75% |
|
Conga, |
|
100% |
|
— |
— |
— |
|
693,800 |
2.06 |
45,900 |
|
693,800 |
2.06 |
45,900 |
|
175,000 |
1.1 |
6,300 |
|
70% |
|
|
|
100% |
|
16,300 |
6.71 |
3,500 |
|
103,900 |
10.16 |
33,900 |
|
120,200 |
9.69 |
37,400 |
|
26,300 |
13.4 |
11,400 |
|
43% |
|
Yanacocha Leach Pad (6) |
|
100% |
|
— |
— |
— |
|
— |
— |
— |
|
— |
— |
— |
|
62,700 |
2.2 |
4,500 |
|
4% |
|
Yanacocha Underground |
|
100% |
|
500 |
0.37 |
— |
|
6,200 |
37.02 |
7,300 |
|
6,700 |
34.23 |
7,400 |
|
3,400 |
40.4 |
4,400 |
|
83% |
|
Total Yanacocha, |
|
100% |
|
16,800 |
6.52 |
3,500 |
|
110,100 |
11.66 |
41,300 |
|
126,900 |
10.98 |
44,800 |
|
92,400 |
6.8 |
20,300 |
|
47% |
|
|
|
40% |
|
8,200 |
7.69 |
2,000 |
|
38,200 |
7.82 |
9,600 |
|
46,400 |
7.80 |
11,600 |
|
5,000 |
6.8 |
1,100 |
|
71% |
|
NuevaUnión, |
|
50% |
|
164,300 |
0.96 |
5,100 |
|
349,900 |
1.19 |
13,400 |
|
514,100 |
1.12 |
18,400 |
|
602,200 |
1.2 |
22,500 |
|
66% |
|
Norte Abierto, |
|
50% |
|
77,200 |
1.20 |
3,000 |
|
596,900 |
1.07 |
20,600 |
|
674,200 |
1.09 |
23,500 |
|
369,600 |
1.0 |
11,300 |
|
78% |
|
Cadia, |
|
100% |
|
— |
— |
— |
|
1,245,100 |
0.65 |
26,100 |
|
1,245,100 |
0.65 |
26,100 |
|
549,400 |
0.4 |
7,900 |
|
67% |
|
Wafi-Golpu, |
|
50% |
|
— |
— |
— |
|
53,600 |
4.42 |
7,600 |
|
53,600 |
4.42 |
7,600 |
|
15,500 |
4.5 |
2,200 |
|
45% |
|
|
|
38.5% |
|
— |
— |
— |
|
98,300 |
5.64 |
17,800 |
|
98,300 |
5.64 |
17,800 |
|
9,400 |
4.2 |
1,300 |
|
38% |
|
NGM Stockpiles |
|
38.5% |
|
— |
— |
— |
|
— |
— |
— |
|
— |
— |
— |
|
900 |
4.6 |
100 |
|
38% |
|
NGM, |
|
38.5% |
|
— |
— |
— |
|
98,300 |
5.64 |
17,800 |
|
98,300 |
5.64 |
17,800 |
|
10,300 |
4.2 |
1,400 |
|
38% |
|
Total Silver |
|
|
|
528,900 |
4.96 |
84,300 |
|
3,760,700 |
3.18 |
385,000 |
|
4,289,600 |
3.40 |
469,200 |
|
1,985,100 |
1.8 |
113,200 |
|
69% |
|
Silver Resources (1)(2) - |
||||||||||||||||||||
|
|
|
|
|
Measured Resource |
|
Indicated Resource |
|
Measured and Indicated Resource |
|
Inferred Resource |
|
|
||||||||
|
Deposits/Districts |
|
Share |
|
Tonnage (000 tonnes) |
Grade (g/tonne) |
Ounces (3) (000) |
|
Tonnage (000 tonnes) |
Grade (g/tonne) |
Ounces (3) (000) |
|
Tonnage (000 tonnes) |
Grade (g/tonne) |
Ounces (3) (000) |
|
Tonnage (000 tonnes) |
Grade (g/tonne) |
Ounces (3) (000) |
|
Metallurgical Recovery (3) |
|
Brucejack, |
|
100% |
|
— |
— |
— |
|
1,800 |
8.09 |
500 |
|
1,800 |
8.09 |
500 |
|
12,100 |
10.0 |
3,900 |
|
85% |
|
|
|
50% |
|
212,800 |
4.08 |
27,900 |
|
385,600 |
4.77 |
59,100 |
|
598,400 |
4.52 |
87,000 |
|
118,900 |
2.6 |
9,900 |
|
73% |
|
Peñasquito, |
|
100% |
|
37,400 |
24.48 |
29,400 |
|
157,300 |
25.12 |
127,100 |
|
194,700 |
25.00 |
156,500 |
|
22,800 |
25.4 |
18,700 |
|
79% |
|
|
|
50% |
|
— |
— |
— |
|
19,900 |
13.99 |
9,000 |
|
19,900 |
13.99 |
9,000 |
|
1,600 |
11.0 |
500 |
|
25% |
|
Cerro Negro Underground |
|
100% |
|
100 |
61.50 |
200 |
|
900 |
60.12 |
1,800 |
|
1,000 |
60.28 |
2,000 |
|
5,900 |
27.5 |
5,200 |
|
75% |
|
|
|
100% |
|
1,200 |
6.77 |
300 |
|
1,200 |
6.63 |
300 |
|
2,400 |
6.70 |
500 |
|
300 |
6.7 |
100 |
|
71% |
|
Total |
|
100% |
|
1,300 |
11.71 |
500 |
|
2,100 |
30.02 |
2,000 |
|
3,400 |
22.95 |
2,500 |
|
6,200 |
26.4 |
5,300 |
|
75% |
|
Conga, |
|
100% |
|
— |
— |
— |
|
693,800 |
2.06 |
45,900 |
|
693,800 |
2.06 |
45,900 |
|
175,000 |
1.1 |
6,300 |
|
70% |
|
|
|
100% |
|
16,100 |
6.76 |
3,500 |
|
105,200 |
10.43 |
35,300 |
|
121,300 |
9.94 |
38,800 |
|
26,400 |
13.5 |
11,500 |
|
44% |
|
Yanacocha Underground |
|
100% |
|
500 |
0.37 |
— |
|
6,200 |
37.02 |
7,300 |
|
6,700 |
34.23 |
7,400 |
|
3,400 |
40.4 |
4,400 |
|
83% |
|
Total Yanacocha, |
|
100% |
|
16,600 |
6.57 |
3,500 |
|
111,300 |
11.91 |
42,600 |
|
128,000 |
11.21 |
46,100 |
|
29,800 |
16.6 |
15,900 |
|
51% |
|
|
|
40% |
|
7,300 |
7.96 |
1,900 |
|
37,300 |
8.04 |
9,600 |
|
44,600 |
8.02 |
11,500 |
|
3,200 |
8.1 |
800 |
|
74% |
|
NuevaUnión, |
|
50% |
|
164,300 |
0.96 |
5,100 |
|
349,900 |
1.19 |
13,400 |
|
514,100 |
1.12 |
18,400 |
|
602,200 |
1.2 |
22,500 |
|
66% |
|
Norte Abierto, |
|
50% |
|
77,200 |
1.20 |
3,000 |
|
596,900 |
1.07 |
20,600 |
|
674,200 |
1.09 |
23,500 |
|
369,600 |
1.0 |
11,300 |
|
78% |
|
Cadia, |
|
100% |
|
— |
— |
— |
|
1,596,600 |
0.61 |
31,300 |
|
1,596,600 |
0.61 |
31,300 |
|
497,000 |
0.5 |
7,500 |
|
65% |
|
Wafi-Golpu, |
|
50% |
|
— |
— |
— |
|
53,600 |
4.42 |
7,600 |
|
53,600 |
4.42 |
7,600 |
|
15,500 |
4.5 |
2,200 |
|
45% |
|
|
|
38.5% |
|
— |
— |
— |
|
93,000 |
5.59 |
16,700 |
|
93,000 |
5.59 |
16,700 |
|
16,700 |
5.4 |
2,900 |
|
38% |
|
NGM Stockpiles |
|
38.5% |
|
— |
— |
— |
|
— |
— |
— |
|
— |
— |
— |
|
1,800 |
5.6 |
300 |
|
38% |
|
NGM, |
|
38.5% |
|
— |
— |
— |
|
93,000 |
5.59 |
16,700 |
|
93,000 |
5.59 |
16,700 |
|
18,400 |
5.4 |
3,200 |
|
38% |
|
Total Silver |
|
|
|
516,900 |
4.29 |
71,300 |
|
4,099,200 |
2.92 |
385,400 |
|
4,616,200 |
3.08 |
456,700 |
|
1,872,300 |
1.8 |
108,100 |
|
68% |
|
(1) |
Resources are reported exclusive of reserves. Amounts presented may not recalculate in total due to rounding. |
|
|
(2) |
At |
|
|
(3) |
Ounces are estimates of metal contained in ore tonnages and do not include allowances for processing losses. Metallurgical recovery rates represent the estimated amount of metal to be recovered through metallurgical extraction processes. Ounces may not recalculate as they are rounded to the nearest 100,000. |
|
|
(4) |
Project is currently undeveloped. Resource estimates provided by Teck Resources. |
|
|
(5) |
Silver resources at |
|
|
(6) |
Leach pad material is the material on leach pads at the end of the year from which silver remains to be recovered. In-process resources are reported separately where ounces exceed 100,000 and are greater than 5% of the total site-reported resources. |
|
|
(7) |
Silver resources related to the undeveloped Yanacocha Sulfides project at |
|
|
(8) |
Silver resources at |
|
|
(9) |
Project is currently undeveloped. Silver resources at |
|
|
(10) |
Project is currently undeveloped. Silver resources at |
|
|
(11) |
Silver resources at |
|
|
(12) |
Currently included in the non-operating segment Corporate and Other in Note 4 to the Consolidated Financial Statements. |
|
|
(13) |
Amounts presented herein have been rounded to the nearest 100,000 for ounces and tonnes and therefore may not agree to the respective Technical Report Summaries provided for certain properties as provided under exhibit 96. |
|
|
(14) |
Sites acquired through the |
|
Lead Reserves (1) |
||||||||||||||||||||
|
|
|
|
||||||||||||||||||
|
|
|
|
|
Proven Reserves |
|
Probable Reserves |
|
Proven and Probable Reserves |
|
|
|
Proven and Probable Reserves |
||||||||
|
Deposits/Districts |
|
Share |
|
Tonnage (2) (000 tonnes) |
Grade (Pb %) |
Tonnes (3) (000) |
|
Tonnage (2) (000 tonnes) |
Grade (Pb %) |
Tonnes (3) (000) |
|
Tonnage (2) (000 tonnes) |
Grade (Pb %) |
Tonnes (3) (000) |
|
Metallurgical Recovery (3) |
|
Tonnage (2) (000 tonnes) |
Grade (Pb %) |
Tonnes (3) (000) |
|
Peñasquito Open Pits, |
|
100% |
|
93,900 |
0.35% |
300 |
|
130,800 |
0.27% |
400 |
|
224,700 |
0.30% |
700 |
|
75% |
|
264,500 |
0.32% |
900 |
|
Peñasquito Stockpiles, |
|
100% |
|
4,700 |
0.28% |
— |
|
27,300 |
0.37% |
100 |
|
32,000 |
0.36% |
100 |
|
68% |
|
26,500 |
0.37% |
100 |
|
Total Lead |
|
|
|
98,600 |
0.35% |
300 |
|
158,100 |
0.29% |
500 |
|
256,600 |
0.31% |
800 |
|
74% |
|
291,000 |
0.33% |
900 |
|
(1) |
At |
|
|
(2) |
Tonnages include allowances for losses resulting from mining methods. Tonnages are rounded to nearest 100,000. |
|
|
(3) |
Tonnes are estimates of metal contained in ore tonnages and do not include allowances for processing losses. Metallurgical recovery rates represent the estimated amount of metal to be recovered through metallurgical extraction processes. Tonnes may not recalculate as they are rounded to the nearest 100,000. |
|
|
(4) |
The net smelter return value utilized in 2024 reserves not less than |
|
|
(5) |
Stockpiles are comprised primarily of material that has been set aside to allow processing of higher grade material in the mills. Stockpiles increase or decrease depending on current mine plans. Stockpile reserves are reported separately where pounds exceed 100 million and are greater than 5% of the total site-reported reserves. |
|
|
(6) |
Amounts presented herein have been rounded to the nearest 100,000 for tonnes and therefore may not agree to the respective Technical Report Summaries provided for certain properties as provided under exhibit 96. |
|
Lead Resources (1)(2) - |
|||||||||||||||||||
|
|
|
|
|
Measured Resource |
|
Indicated Resource |
|
Measured and Indicated Resource |
Inferred Resource |
|
|
||||||||
|
Deposits/Districts |
|
Share |
|
Tonnage (000 tonnes) |
Grade (Pb %) |
Tonnes (3) (000) |
|
Tonnage (000 tonnes) |
Grade (Pb %) |
Tonnes (3) (000) |
|
Tonnage (000 tonnes) |
Grade (Pb %) |
Tonnes (3) (000) |
Tonnage (000 tonnes) |
Grade (Pb %) |
Tonnes (3) (000) |
|
Metallurgical Recovery (3) |
|
Peñasquito, |
|
100% |
|
48,200 |
0.25% |
100 |
|
163,100 |
0.23% |
400 |
|
211,300 |
0.23% |
500 |
21,100 |
0.2% |
— |
|
73% |
|
Total Lead |
|
|
|
48,200 |
0.25% |
100 |
|
163,100 |
0.23% |
400 |
|
211,300 |
0.23% |
500 |
21,100 |
0.2% |
— |
|
73% |
|
Lead Resources (1)(2) - |
|||||||||||||||||||
|
|
|
|
|
Measured Resource |
|
Indicated Resource |
|
Measured and Indicated Resource |
Inferred Resource |
|
|
||||||||
|
Deposits/Districts |
|
Share |
|
Tonnage (000 tonnes) |
Grade (Pb %) |
Tonnes (3) (000) |
|
Tonnage (000 tonnes) |
Grade (Pb %) |
Tonnes (3) (000) |
|
Tonnage (000 tonnes) |
Grade (Pb %) |
Tonnes (3) (000) |
Tonnage (000 tonnes) |
Grade (Pb %) |
Tonnes (3) (000) |
|
Metallurgical Recovery (3) |
|
Peñasquito, |
|
100% |
|
37,400 |
0.28% |
100 |
|
157,300 |
0.24% |
400 |
|
194,700 |
0.24% |
500 |
22,800 |
0.2% |
100 |
|
72% |
|
Telfer Projects, |
|
100% |
|
— |
—% |
— |
|
51,700 |
0.30% |
200 |
|
51,700 |
0.30% |
200 |
1,900 |
0.2% |
— |
|
89% |
|
Total Lead |
|
|
|
37,400 |
0.28% |
100 |
|
209,100 |
0.25% |
500 |
|
246,500 |
0.26% |
600 |
24,700 |
0.2% |
100 |
|
76% |
|
(1) |
Resources are reported exclusive of reserves. |
|
|
(2) |
At |
|
|
(3) |
Tonnes are estimates of metal contained in ore tonnages and do not include allowances for processing losses. Metallurgical recovery rates represent the estimated amount of metal to be recovered through metallurgical extraction processes. Tonnes may not recalculate as they are rounded to the nearest 100,000. |
|
|
(4) |
Amounts presented herein have been rounded to the nearest 100,000 for tonnes and therefore may not agree to the respective Technical Report Summaries provided for certain properties as provided under exhibit 96. |
|
|
(5) |
Site acquired through the |
|
|
(6) |
In the fourth quarter of 2024, the Company completed the sale of the assets of the Telfer reportable segment, which includes the Havieron development project. Refer to Note 3 to the Consolidated Financial Statements for further information. |
|
Zinc Reserves (1) |
||||||||||||||||||||
|
|
|
|
||||||||||||||||||
|
|
|
|
|
Proven Reserves |
|
Probable Reserves |
|
Proven and Probable Reserves |
|
|
|
Proven and Probable Reserves |
||||||||
|
Deposits/Districts |
|
Share |
|
Tonnage (2) (000 tonnes) |
Grade (Zn %) |
Tonnes (3) (000) |
|
Tonnage (2) (000 tonnes) |
Grade (Zn %) |
Tonnes (3) (000) |
|
Tonnage (2) (000 tonnes) |
Grade (Zn %) |
Tonnes (3) (000) |
|
Metallurgical Recovery (3) |
|
Tonnage (2) (000 tonnes) |
Grade (Zn %) |
Tonnes (3) (000) |
|
Peñasquito Open Pits, |
|
100% |
|
93,900 |
0.81% |
800 |
|
130,800 |
0.60% |
800 |
|
224,700 |
0.69% |
1,500 |
|
83% |
|
264,500 |
0.79% |
2,100 |
|
Peñasquito Stockpiles, |
|
100% |
|
4,700 |
0.80% |
— |
|
27,300 |
0.54% |
100 |
|
32,000 |
0.58% |
200 |
|
75% |
|
26,500 |
0.53% |
100 |
|
Total Zinc |
|
|
|
98,600 |
0.81% |
800 |
|
158,100 |
0.59% |
900 |
|
256,600 |
0.68% |
1,700 |
|
82% |
|
291,000 |
0.77% |
2,200 |
|
(1) |
At |
|
|
(2) |
Tonnages include allowances for losses resulting from mining methods. Tonnages are rounded to nearest 100,000. |
|
|
(3) |
Tonnes are estimates of metal contained in ore tonnages and do not include allowances for processing losses. Metallurgical recovery rates represent the estimated amount of metal to be recovered through metallurgical extraction processes. Tonnes may not recalculate as they are rounded to the nearest 100,000. |
|
|
(4) |
The net smelter return value utilized in 2024 reserves not less than |
|
|
(5) |
Stockpiles are comprised primarily of material that has been set aside to allow processing of higher grade material in the mills. Stockpiles increase or decrease depending on current mine plans. Stockpile reserves are reported separately where pounds exceed 100 million and are greater than 5% of the total site-reported reserves. |
|
|
(6) |
Amounts presented herein have been rounded to the nearest 100,000 for tonnes and therefore may not agree to the respective Technical Report Summaries provided for certain properties as provided under exhibit 96. |
|
Zinc Resources (1)(2) - |
||||||||||||||||||
|
|
|
|
|
Measured Resource |
|
Indicated Resource |
Measured and Indicated Resource |
Inferred Resource |
|
|
||||||||
|
Deposits/Districts |
|
Share |
|
Tonnage (000 tonnes) |
Grade (Zn %) |
Tonnes (3) (000) |
|
Tonnage (000 tonnes) |
Grade (Zn %) |
Tonnes (3) (000) |
Tonnage (000 tonnes) |
Grade (Zn %) |
Tonnes (3) (000) |
Tonnage (000 tonnes) |
Grade (Zn %) |
Tonnes (3) (000) |
|
Metallurgical Recovery (3) |
|
Peñasquito, |
|
100% |
|
48,200 |
0.69% |
300 |
|
163,100 |
0.55% |
900 |
211,300 |
0.59% |
1,200 |
21,100 |
0.6% |
100 |
|
81% |
|
Total Zinc |
|
|
|
48,200 |
0.69% |
300 |
|
163,100 |
0.55% |
900 |
211,300 |
0.59% |
1,200 |
21,100 |
0.6% |
100 |
|
81% |
|
Zinc Resources (1)(2) - |
||||||||||||||||||
|
|
|
|
|
Measured Resource |
|
Indicated Resource |
Measured and Indicated Resource |
Inferred Resource |
|
|
||||||||
|
Deposits/Districts |
|
Share |
|
Tonnage (000 tonnes) |
Grade (Zn %) |
Tonnes (3) (000) |
|
Tonnage (000 tonnes) |
Grade (Zn %) |
Tonnes (3) (000) |
Tonnage (000 tonnes) |
Grade (Zn %) |
Tonnes (3) (000) |
Tonnage (000 tonnes) |
Grade (Zn %) |
Tonnes (3) (000) |
|
Metallurgical Recovery (3) |
|
Peñasquito, |
|
100% |
|
37,400 |
0.69% |
300 |
|
157,300 |
0.59% |
900 |
194,700 |
0.61% |
1,200 |
22,800 |
0.6% |
100 |
|
81% |
|
Telfer Projects, |
|
100% |
|
— |
—% |
— |
|
51,700 |
0.30% |
300 |
51,700 |
0.30% |
300 |
1,900 |
0.2% |
— |
|
89% |
|
Total Zinc |
|
|
|
37,400 |
0.69% |
300 |
|
209,100 |
0.60% |
1,300 |
246,500 |
0.61% |
1,500 |
24,700 |
0.6% |
100 |
|
80% |
|
(1) |
Resources are reported exclusive of reserves. |
|
|
(2) |
At |
|
|
(3) |
Tonnes are estimates of metal contained in ore tonnages and do not include allowances for processing losses. Metallurgical recovery rates represent the estimated amount of metal to be recovered through metallurgical extraction processes. Tonnes may not recalculate as they are rounded to the nearest 100,000. |
|
|
(4) |
Amounts presented herein have been rounded to the nearest 100,000 for tonnes and therefore may not agree to the respective Technical Report Summaries provided for certain properties as provided under exhibit 96. |
|
|
(5) |
Site acquired through the |
|
|
(6) |
In the fourth quarter of 2024, the Company completed the sale of the assets of the Telfer reportable segment, which includes the Havieron development project. Refer to Note 3 to the Consolidated Financial Statements for further information. |
|
Molybdenum Reserves (1) |
||||||||||||||||||||
|
|
|
|
||||||||||||||||||
|
|
|
|
|
Proven Reserves |
|
Probable Reserves |
|
Proven and Probable Reserves |
|
|
|
Proven and Probable Reserves |
||||||||
|
Deposits/Districts |
|
Share |
|
Tonnage (2) (000 tonnes) |
Grade (Mo %) |
Tonnes (3) (000) |
|
Tonnage (2) (000 tonnes) |
Grade (Mo %) |
Tonnes (3) (000) |
|
Tonnage (2) (000 tonnes) |
Grade (Mo %) |
Tonnes (3) (000) |
|
Metallurgical Recovery (3) |
|
Tonnage (2) (000 tonnes) |
Grade (Mo %) |
Tonnes (3) (000) |
|
NuevaUnión, |
|
50% |
|
— |
— % |
— |
|
776,900 |
0.02 % |
100 |
|
776,900 |
0.02 % |
100 |
|
48% |
|
776,900 |
0.02% |
100 |
|
Cadia, |
|
100% |
|
— |
— % |
— |
|
1,040,600 |
0.01 % |
100 |
|
1,040,600 |
0.01 % |
100 |
|
67% |
|
1,085,100 |
0.01% |
100 |
|
Total Molybdenum |
|
|
|
— |
— % |
— |
|
1,817,500 |
0.01 % |
200 |
|
1,817,500 |
0.01 % |
200 |
|
56% |
|
1,862,000 |
0.01% |
200 |
|
(1) |
At |
|
|
(2) |
Tonnages include allowances for losses resulting from mining methods. Tonnages are rounded to nearest 100,000. |
|
|
(3) |
Tonnes are estimates of metal contained in ore tonnages and do not include allowances for processing losses. Metallurgical recovery rates represent the estimated amount of metal to be recovered through metallurgical extraction processes. Tonnes may not recalculate as they are rounded to the nearest 100,000. |
|
|
(4) |
Project is currently undeveloped. Molybdenum reserves at |
|
|
(5) |
Currently included in the non-operating segment Corporate and Other in Note 4 to the Consolidated Financial Statements. |
|
|
(6) |
The net smelter return value utilized in 2024 reserves not less than |
|
|
(7) |
Amounts presented herein have been rounded to the nearest 100,000 for tonnes and therefore may not agree to the respective Technical Report Summaries provided for certain properties as provided under exhibit 96. |
|
|
(8) |
Site acquired through the |
|
Molybdenum Resources (1)(2) - |
||||||||||||||||||
|
|
|
|
|
Measured Resource |
|
Indicated Resource |
Measured and Indicated Resource |
Inferred Resource |
|
|
||||||||
|
Deposits/Districts |
|
Share |
|
Tonnage (000 tonnes) |
Grade (Mo %) |
Tonnes (3) (000) |
|
Tonnage (000 tonnes) |
Grade (Mo %) |
Tonnes (3) (000) |
Tonnage (000 tonnes) |
Grade (Mo %) |
Tonnes (3) (000) |
Tonnage (000 tonnes) |
Grade (Mo %) |
Tonnes (3) (000) |
|
Metallurgical Recovery (3) |
|
NuevaUnión, |
|
50% |
|
159,500 |
0.01% |
— |
|
231,500 |
0.01% |
— |
391,000 |
0.01% |
— |
362,300 |
—% |
— |
|
52% |
|
Cadia, |
|
100% |
|
— |
—% |
— |
|
1,173,900 |
0.01% |
100 |
1,173,900 |
0.01% |
100 |
509,600 |
—% |
— |
|
72% |
|
Total Molybdenum |
|
|
|
159,500 |
0.01% |
— |
|
1,405,400 |
0.01% |
100 |
1,564,900 |
0.01% |
100 |
872,000 |
—% |
100 |
|
62% |
|
Molybdenum Resources (1)(2) - |
||||||||||||||||||
|
|
|
|
|
Measured Resource |
|
Indicated Resource |
Measured and Indicated Resource |
Inferred Resource |
|
|
||||||||
|
Deposits/Districts |
|
Share |
|
Tonnage (000 tonnes) |
Grade (Mo %) |
Tonnes (3) (000) |
|
Tonnage (000 tonnes) |
Grade (Mo %) |
Tonnes (3) (000) |
Tonnage (000 tonnes) |
Grade (Mo %) |
Tonnes (3) (000) |
Tonnage (000 tonnes) |
Grade (Mo %) |
Tonnes (3) (000) |
|
Metallurgical Recovery (3) |
|
NuevaUnión, |
|
50% |
|
159,500 |
0.01% |
— |
|
231,500 |
0.01% |
— |
391,000 |
0.01% |
— |
362,300 |
—% |
— |
|
52% |
|
Cadia, |
|
100% |
|
— |
—% |
— |
|
1,515,400 |
0.01% |
100 |
1,515,400 |
0.01% |
100 |
497,000 |
—% |
— |
|
72% |
|
Total Molybdenum |
|
|
|
159,500 |
0.01% |
— |
|
1,746,900 |
0.01% |
100 |
1,906,400 |
0.01% |
100 |
859,400 |
—% |
100 |
|
60% |
|
(1) |
Resources are reported exclusive of reserves. |
|
|
(2) |
At |
|
|
(3) |
Tonnes are estimates of metal contained in ore tonnages and do not include allowances for processing losses. Metallurgical recovery rates represent the estimated amount of metal to be recovered through metallurgical extraction processes. Tonnes may not recalculate as they are rounded to the nearest 100,000. |
|
|
(4) |
Project is currently undeveloped and is included in Corporate and Other in Note 4 to the Consolidated Financial Statements. Molybdenum resources at |
|
|
(5) |
Amounts presented herein have been rounded to the nearest 100,000 for tonnes and therefore may not agree to the respective Technical Report Summaries provided for certain properties as provided under exhibit 96. |
|
|
(6) |
Site acquired through the |
|
Tungsten Resources at |
||||||||||||||||||
|
|
|
|
|
Measured Resource |
|
Indicated Resource |
Measured and Indicated Resource |
Inferred Resource |
|
|
||||||||
|
Deposits/Districts |
|
Share |
|
Tonnage (000 tonnes) |
Grade (W %) |
Tonnes (3) (000) |
|
Tonnage (000 tonnes) |
Grade (W %) |
Tonnes (3) (000) |
Tonnage (000 tonnes) |
Grade (W %) |
Tonnes (3) (000) |
Tonnage (000 tonnes) |
Grade (W %) |
Tonnes (3) (000) |
|
Metallurgical Recovery (3) |
|
Telfer Projects, |
|
100% |
|
— |
—% |
— |
|
51,700 |
0.35% |
200 |
51,700 |
0.35% |
200 |
1,900 |
0.4% |
— |
|
74% |
|
Total Tungsten |
|
|
|
— |
—% |
— |
|
51,700 |
0.35% |
200 |
51,700 |
0.35% |
200 |
1,900 |
0.4% |
— |
|
74% |
|
(1) |
Resources are reported exclusive of reserves. |
|
|
(2) |
At |
|
|
(3) |
Tonnes are estimates of metal contained in ore tonnages and do not include allowances for processing losses. Metallurgical recovery rates represent the estimated amount of metal to be recovered through metallurgical extraction processes. Tonnes may not recalculate as they are rounded to the nearest 100,000. |
Cautionary Statement Regarding Reserve and Resource Estimates:
The reserves stated herein were prepared in compliance with Subpart 1300 of Regulation S-K adopted by the
Estimates of Proven and Probable reserves are subject to considerable uncertainty. Such estimates are, or will be, to a large extent, based on the prices of gold, silver, copper, zinc, lead, molybdenum and tungsten and interpretations of geologic data obtained from drill holes and other exploration techniques, which data may not necessarily be indicative of future results. If our reserve estimations are required to be revised using significantly lower gold, silver, zinc, copper, lead, molybdenum and tungsten prices as a result of a decrease in commodity prices, increases in operating costs, reductions in metallurgical recovery or other modifying factors, this could result in material write-downs of our investment in mining properties, goodwill and increased amortization, reclamation and closure charges. Producers use pre-feasibility and feasibility studies for undeveloped ore bodies to derive estimates of capital and operating costs based upon anticipated tonnage and grades of ore to be mined and processed, the predicted configuration of the ore body, expected recovery rates of metals from the ore, the costs of comparable facilities, the costs of operating and processing equipment and other factors. Actual operating and capital cost and economic returns on projects may differ significantly from original estimates. Further, it may take many years from the initial phases of exploration until commencement of production, during which time, the economic feasibility of production may change. Estimates of resources are subject to further exploration and development, are subject to additional risks, and no assurance can be given that they will eventually convert to future reserves. Inferred resources, in particular, have a great amount of uncertainty as to their existence and their economic and legal feasibility. Investors are cautioned not to assume that any part of all of the Inferred resource exists or is economically or legally mineable. The Company cannot be certain that any part or parts of the resource will ever be converted into reserves. In addition, if the price of gold, silver, copper, zinc, lead, molybdenum or tungsten declines from recent levels, if production costs increase, grades decline, recovery rates decrease or if applicable laws and regulations are adversely changed, the indicated level of recovery may not be realized or mineral reserves or resources might not be mined or processed profitably. If we determine that certain of our mineral reserves or resources have become uneconomic, this may ultimately lead to a reduction in our aggregate reported mineral reserves and resources. Consequently, if our actual mineral reserves and resources are less than current estimates, our business, prospects, results of operations and financial position may be materially impaired. For additional information see the “Proven and Probable Reserve" and "Measured and Indicated and Inferred Resource" tables herein.
Cautionary Statement Regarding Forward Looking Statements:
This release may contain “forward-looking statements” within the meaning of Section 27A of the Securities Act of 1933, as amended, and Section 21E of the Securities Exchange Act of 1934, as amended, which are intended to be covered by the safe harbor created by such sections and other applicable laws. Such forward-looking statements may include, without limitation, estimates and expectations of future production, reserve estimates, exploration outlook and expected expenditure, and operational and financial performance. Where the Company expresses or implies an expectation or belief as to future events or results, such expectation or belief is expressed in good faith and believed to have a reasonable basis. However, such statements are subject to risks, uncertainties, assumptions and other factors, which could cause actual results to differ materially from future results expressed or implied by the “forward-looking statements”. Such assumptions, include, but are not limited to the key assumptions set forth on page 5 herein. Investors are also encouraged to refer to the Company’s Form 10-K for its fiscal year 2024, filed with the
Note Regarding Go-Forward Tier 1 Portfolio :
Newmont’s go-forward Tier 1 portfolio is focused on Tier 1 assets, consisting of (1) six managed Tier 1 assets (Boddington, Tanami, Cadia, Lihir, Peñasquito, and Ahafo), (2) assets owned through two non-managed joint ventures at Nevada Gold Mines and
Tier 1 Assets are defined as having, on average over such asset’s mine life: (1) production of over 500,000 GEO’s/year on a consolidated basis, (2) average all-in sustaining cost ("AISC") / oz in the lower half of the industry cost curve, (3) an expected mine life of over 10 years, and (4) operations in countries that are classified in the A and B rating ranges for Moody’s, S&P and Fitch. For the definition of GEOs and AISC, see Newmont’s annual report on Form 10-K on file with the
Note that this classification is based on the reasonable good faith expectations of management as of the date hereof based on an assessment that considers past performance, as well as expectations over the remainder of the life of mine. As such, Tier 1 Asset classifications are forward-looking statement with respect to the average over the life of mine. For example, an asset may not fit one element of such definition due to a change over a select period, but continue to be designated as a Tier 1 Asset based on an aggregated assessment of the asset over the life of mine. Estimates or expectations of future production, AISC, mine life and country ratings are based upon certain assumptions, which may prove to be incorrect. Such assumptions, include, but are not limited to: (i) there being no significant change to current geotechnical, metallurgical, hydrological and other physical conditions; (ii) permitting, development, operations and expansion of Newmont’s operations and projects being consistent with current expectations and mine plans; (iii) political developments being consistent with current expectations; (iv) certain price assumptions for gold, copper, silver, zinc, lead and oil; (v) prices for key supplies; (vi) the accuracy of current mineral reserve, mineral resource and mineralized material estimates; and (vii) other planning assumptions.
About
View source version on businesswire.com: https://www.businesswire.com/news/home/20250220938621/en/
Investor Contact - Global
investor.relations@newmont.com
Investor Contact -
apac.investor.relations@newmont.com
Media Contact - Global
globalcommunications@newmont.com
Media Contact -
australiacommunications@newmont.com
Source:
